A simple data analysis of diabetic data using python
The dataset ‘diabetic_data.csv’ contains records of diabetic patients admitted to US hospitals from 1999 to 2008. The goal is to monitor and prevent readmission of patients as this is a metric of potential poor care as well as a financial burden to patients, insurers, governments and health care providers by developing a predictive model that predicts which hospitalized diabetic patients will be readmitted for their condition at a later date and use a K-Means approach to propose a non-trivial set of patients’ clusters that may make business sense to the healthcare industry.
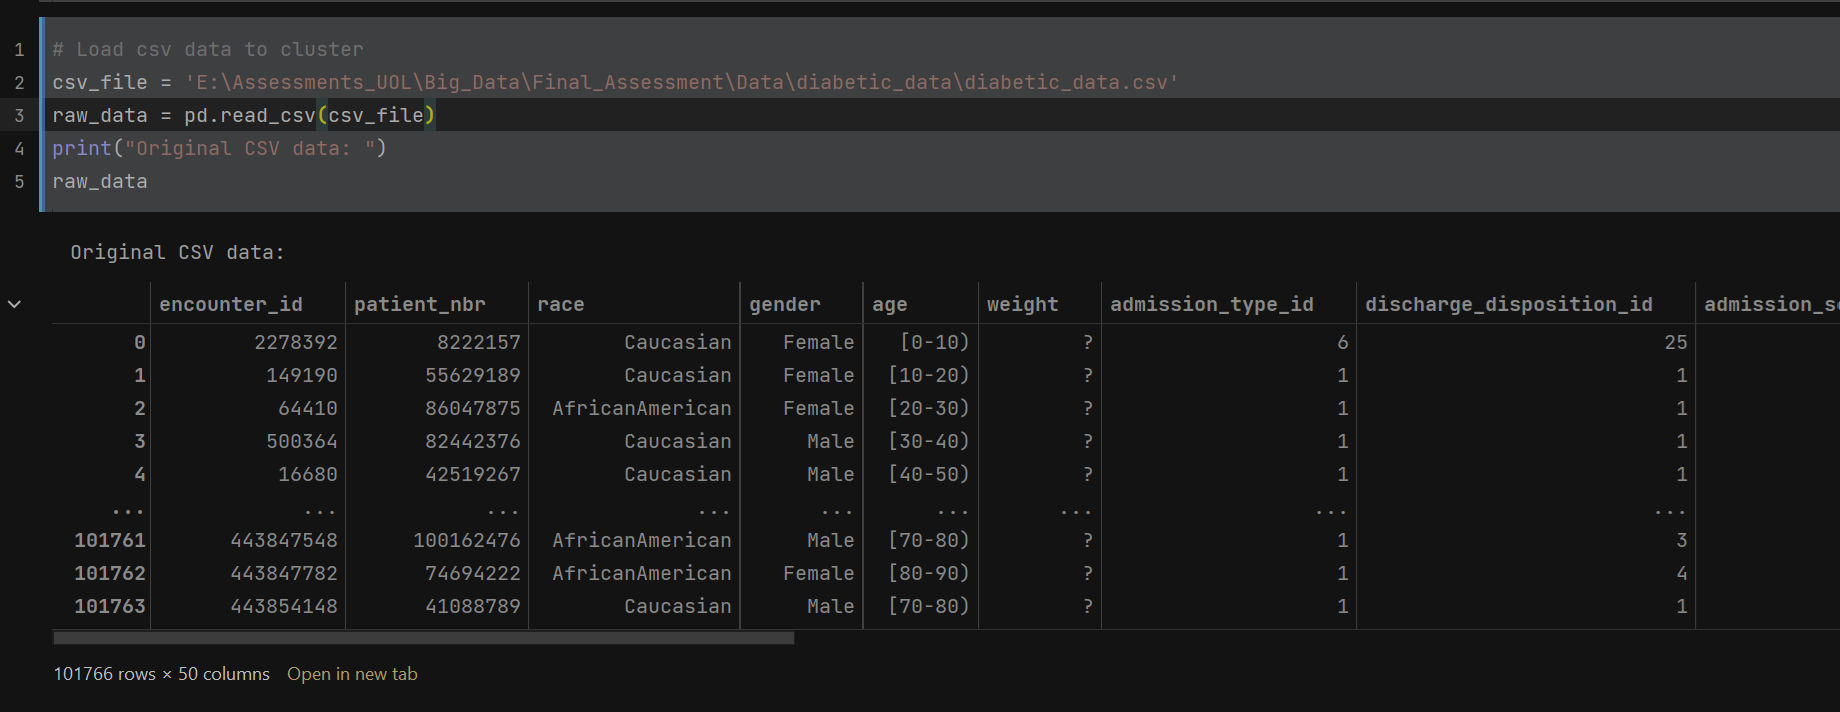
• Raw data shape – 101766 rows x 50 columns
• As the dataset has many missing values, we can drop columns that has more than fifty percent of missing values such as weight and also dropping columns for which over 95% of their values are the same.
• Transforming the row column to its middle values, replacing all missing values of diag_1, diag_2, and diag_3 by the number 0 and drop all rows with missing values
• Removing outliers to only keep values that are within 3 standard deviations away from the mean for each feature of the dataset and removed duplicates in ‘patient_nbr’ column.
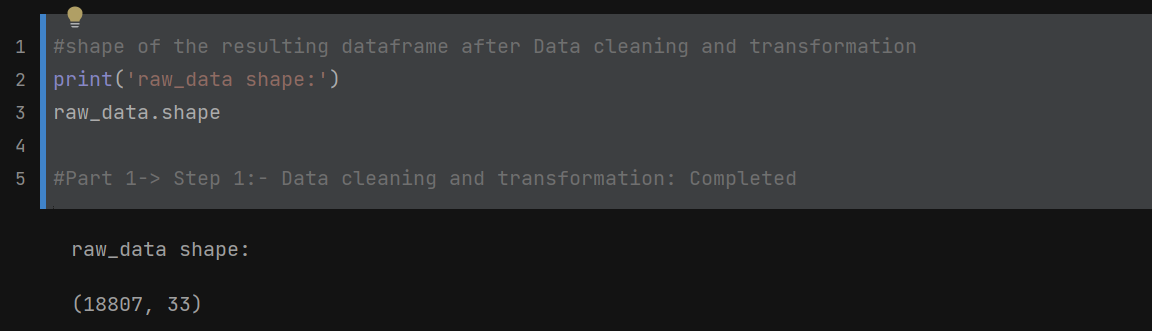
• Shape of the resulting data set - 18807 rows x 33 columns
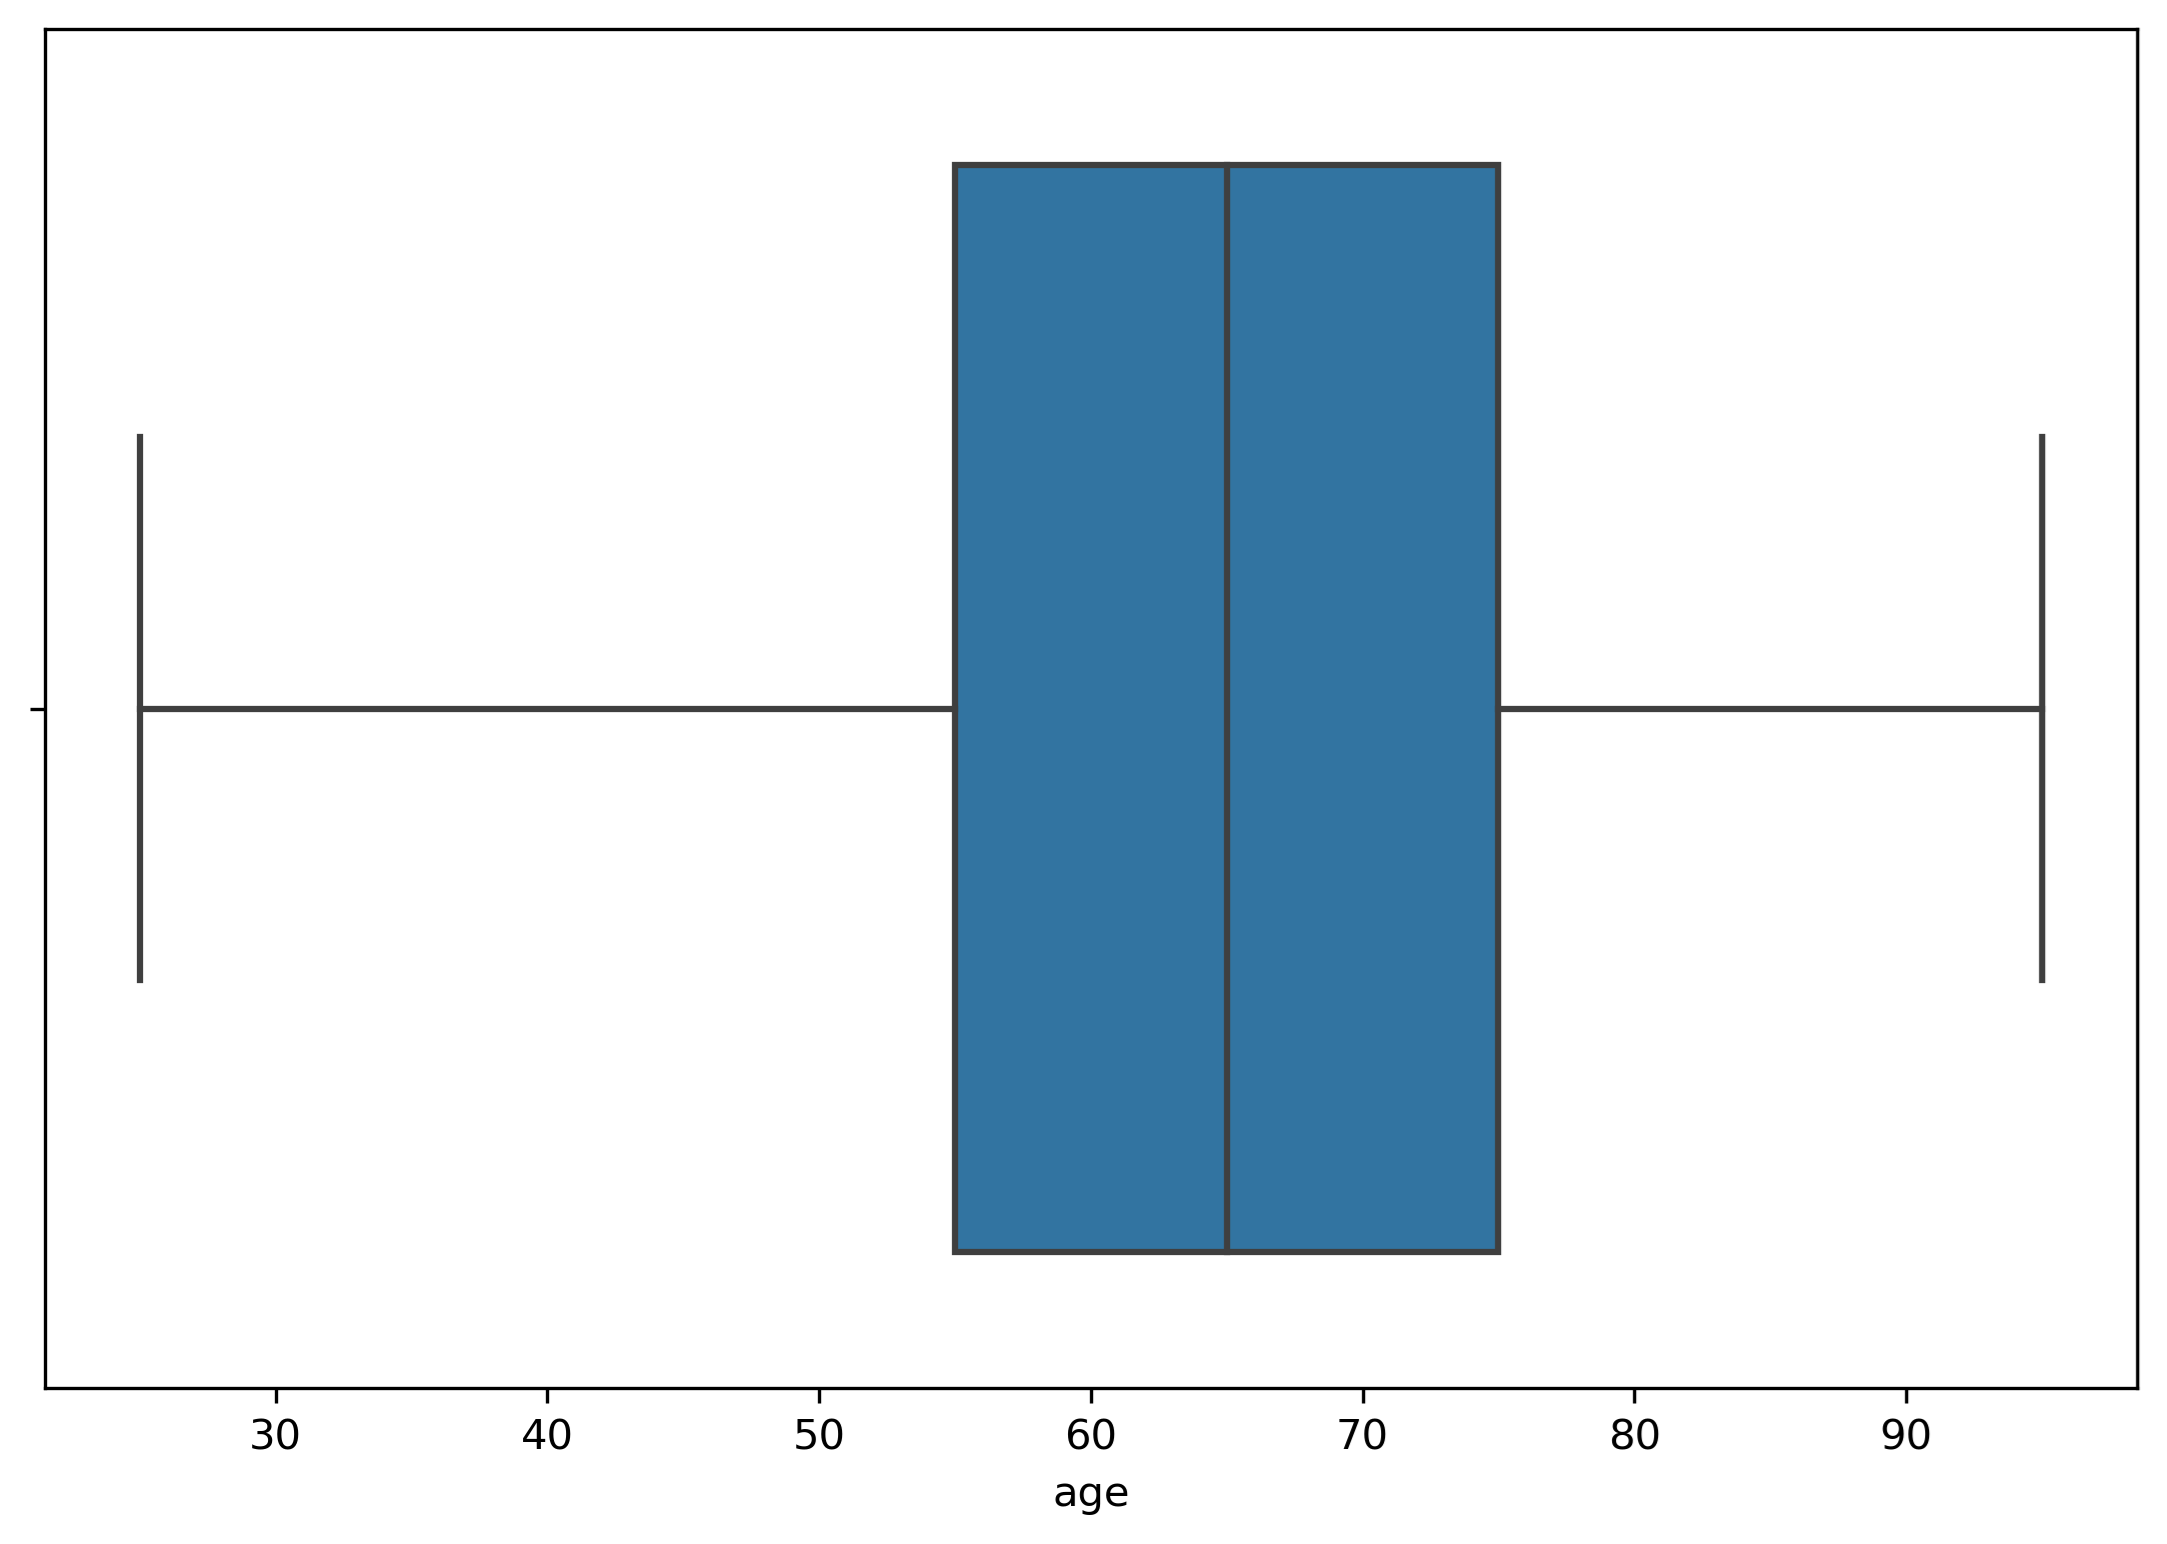
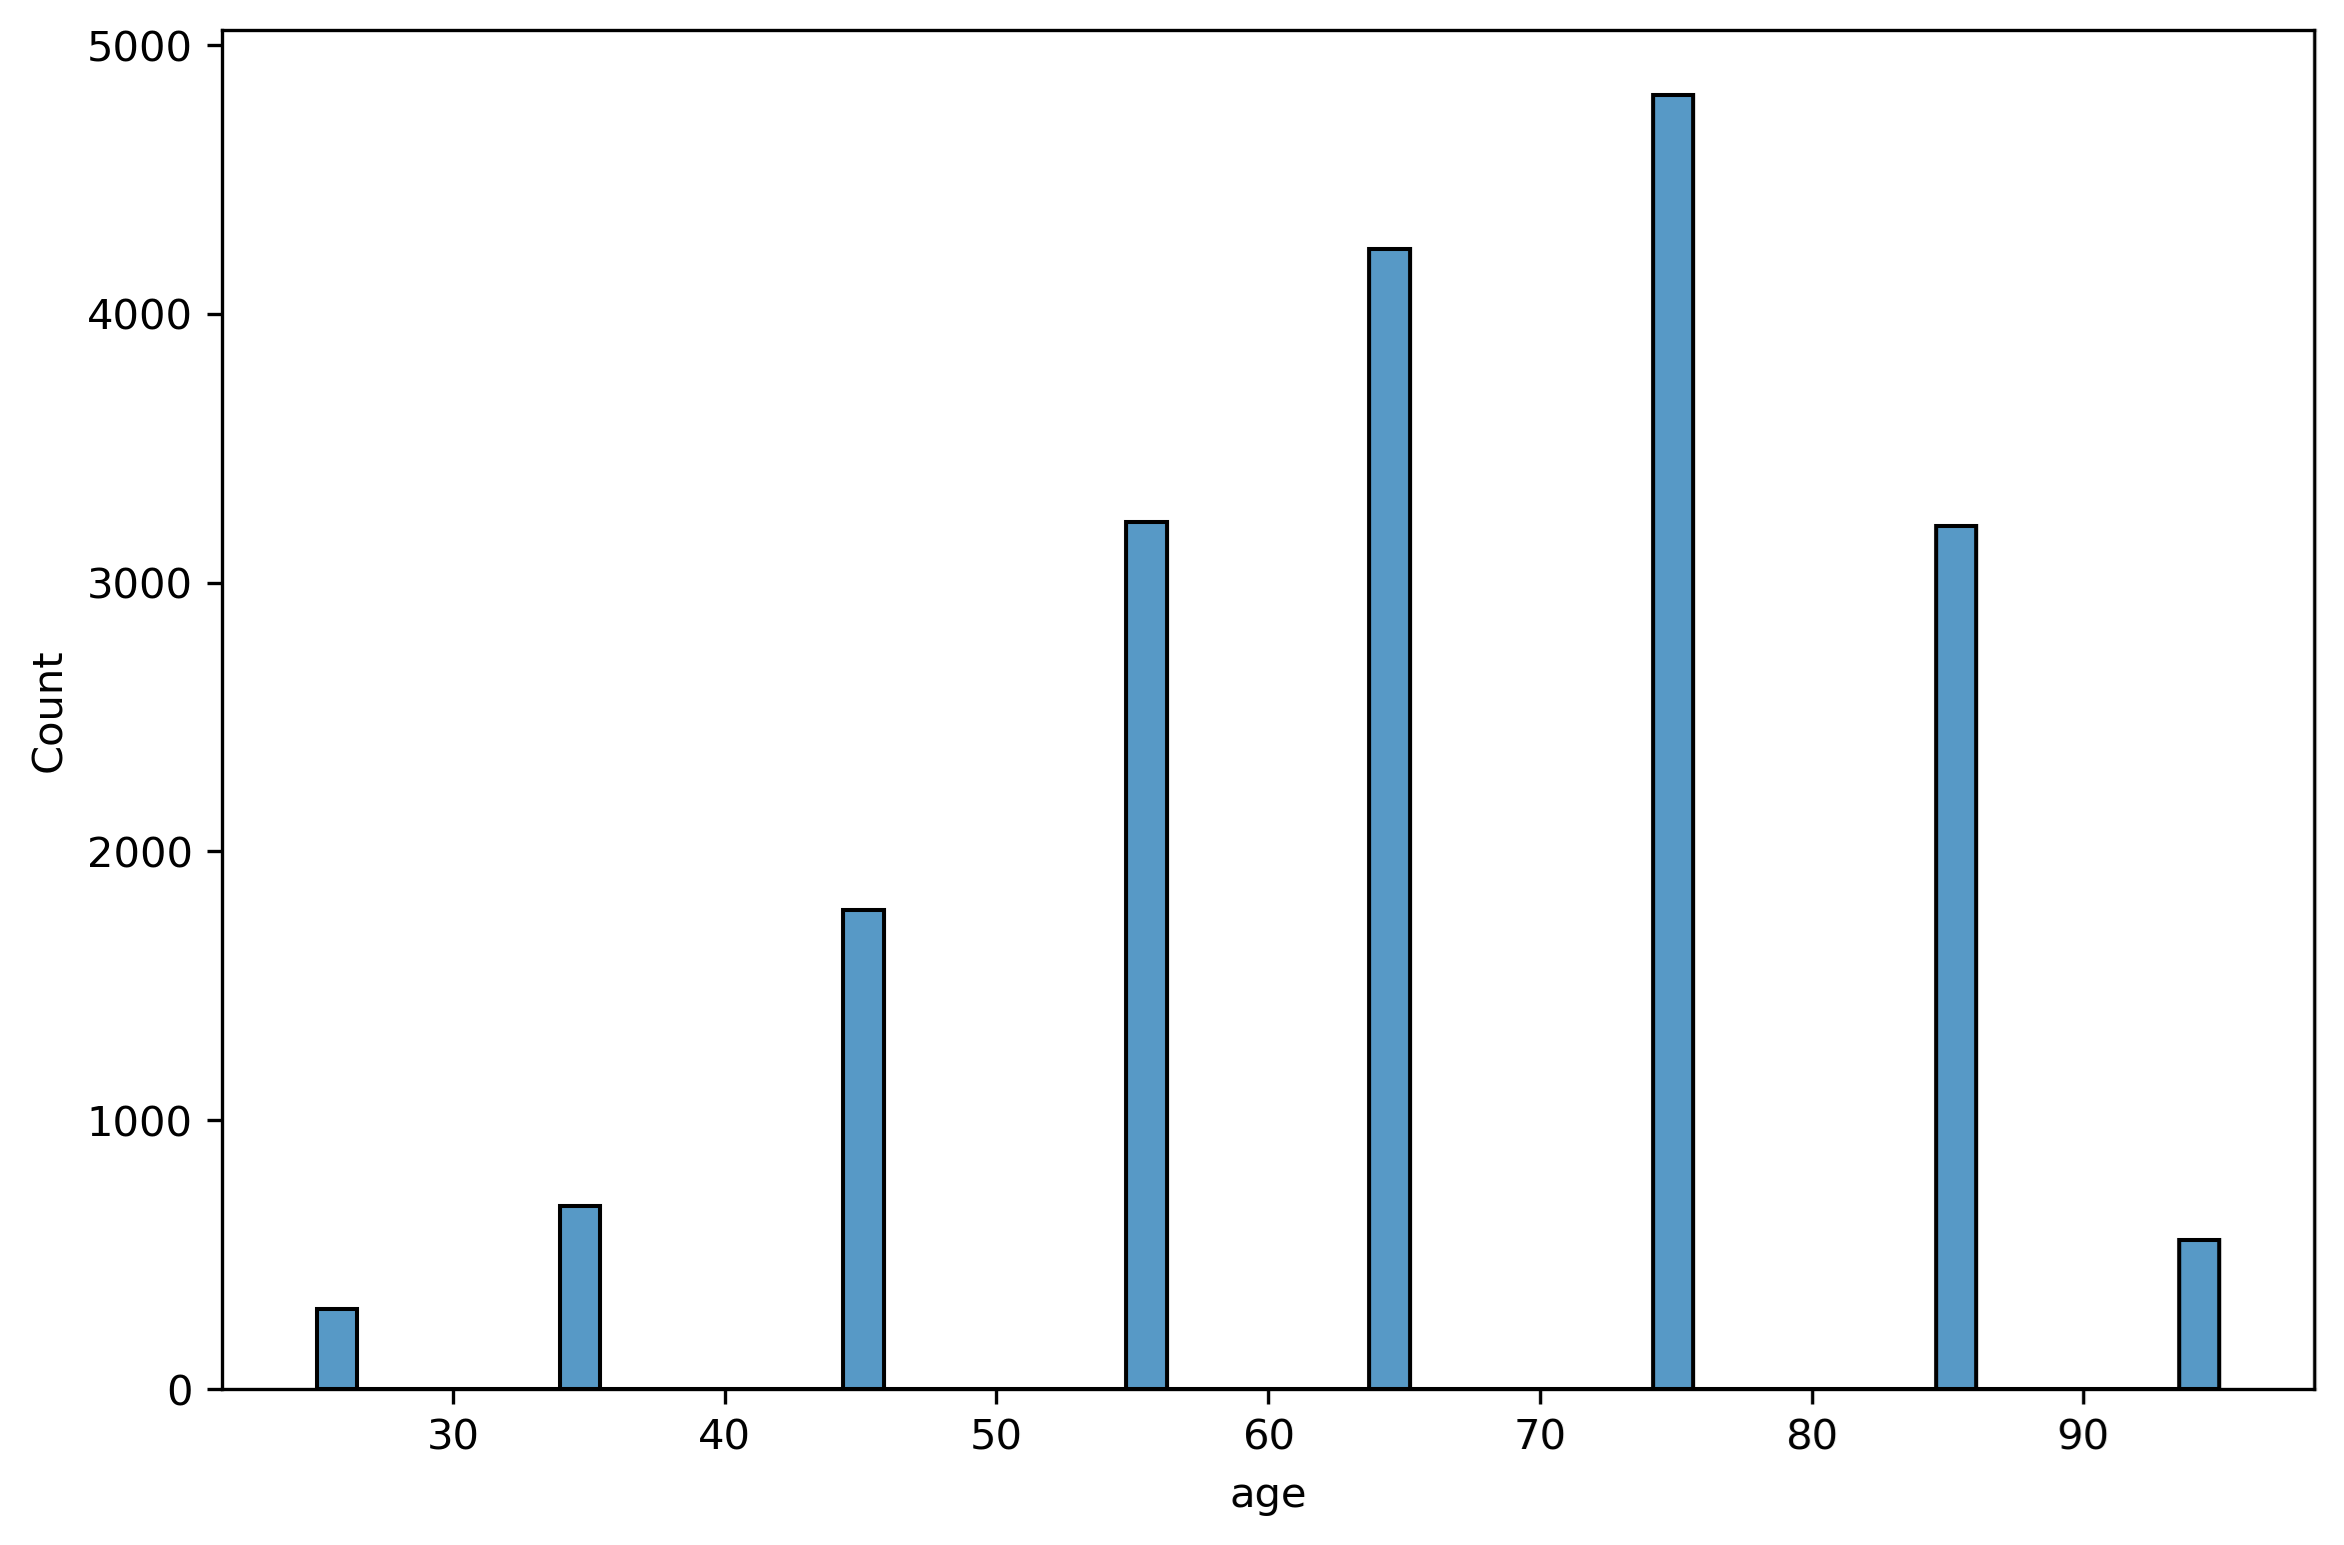
• Age vs Readmission
The plots below shows that age has higher impact on readmission so the hypothesis age has a higher impact on readmission is true.
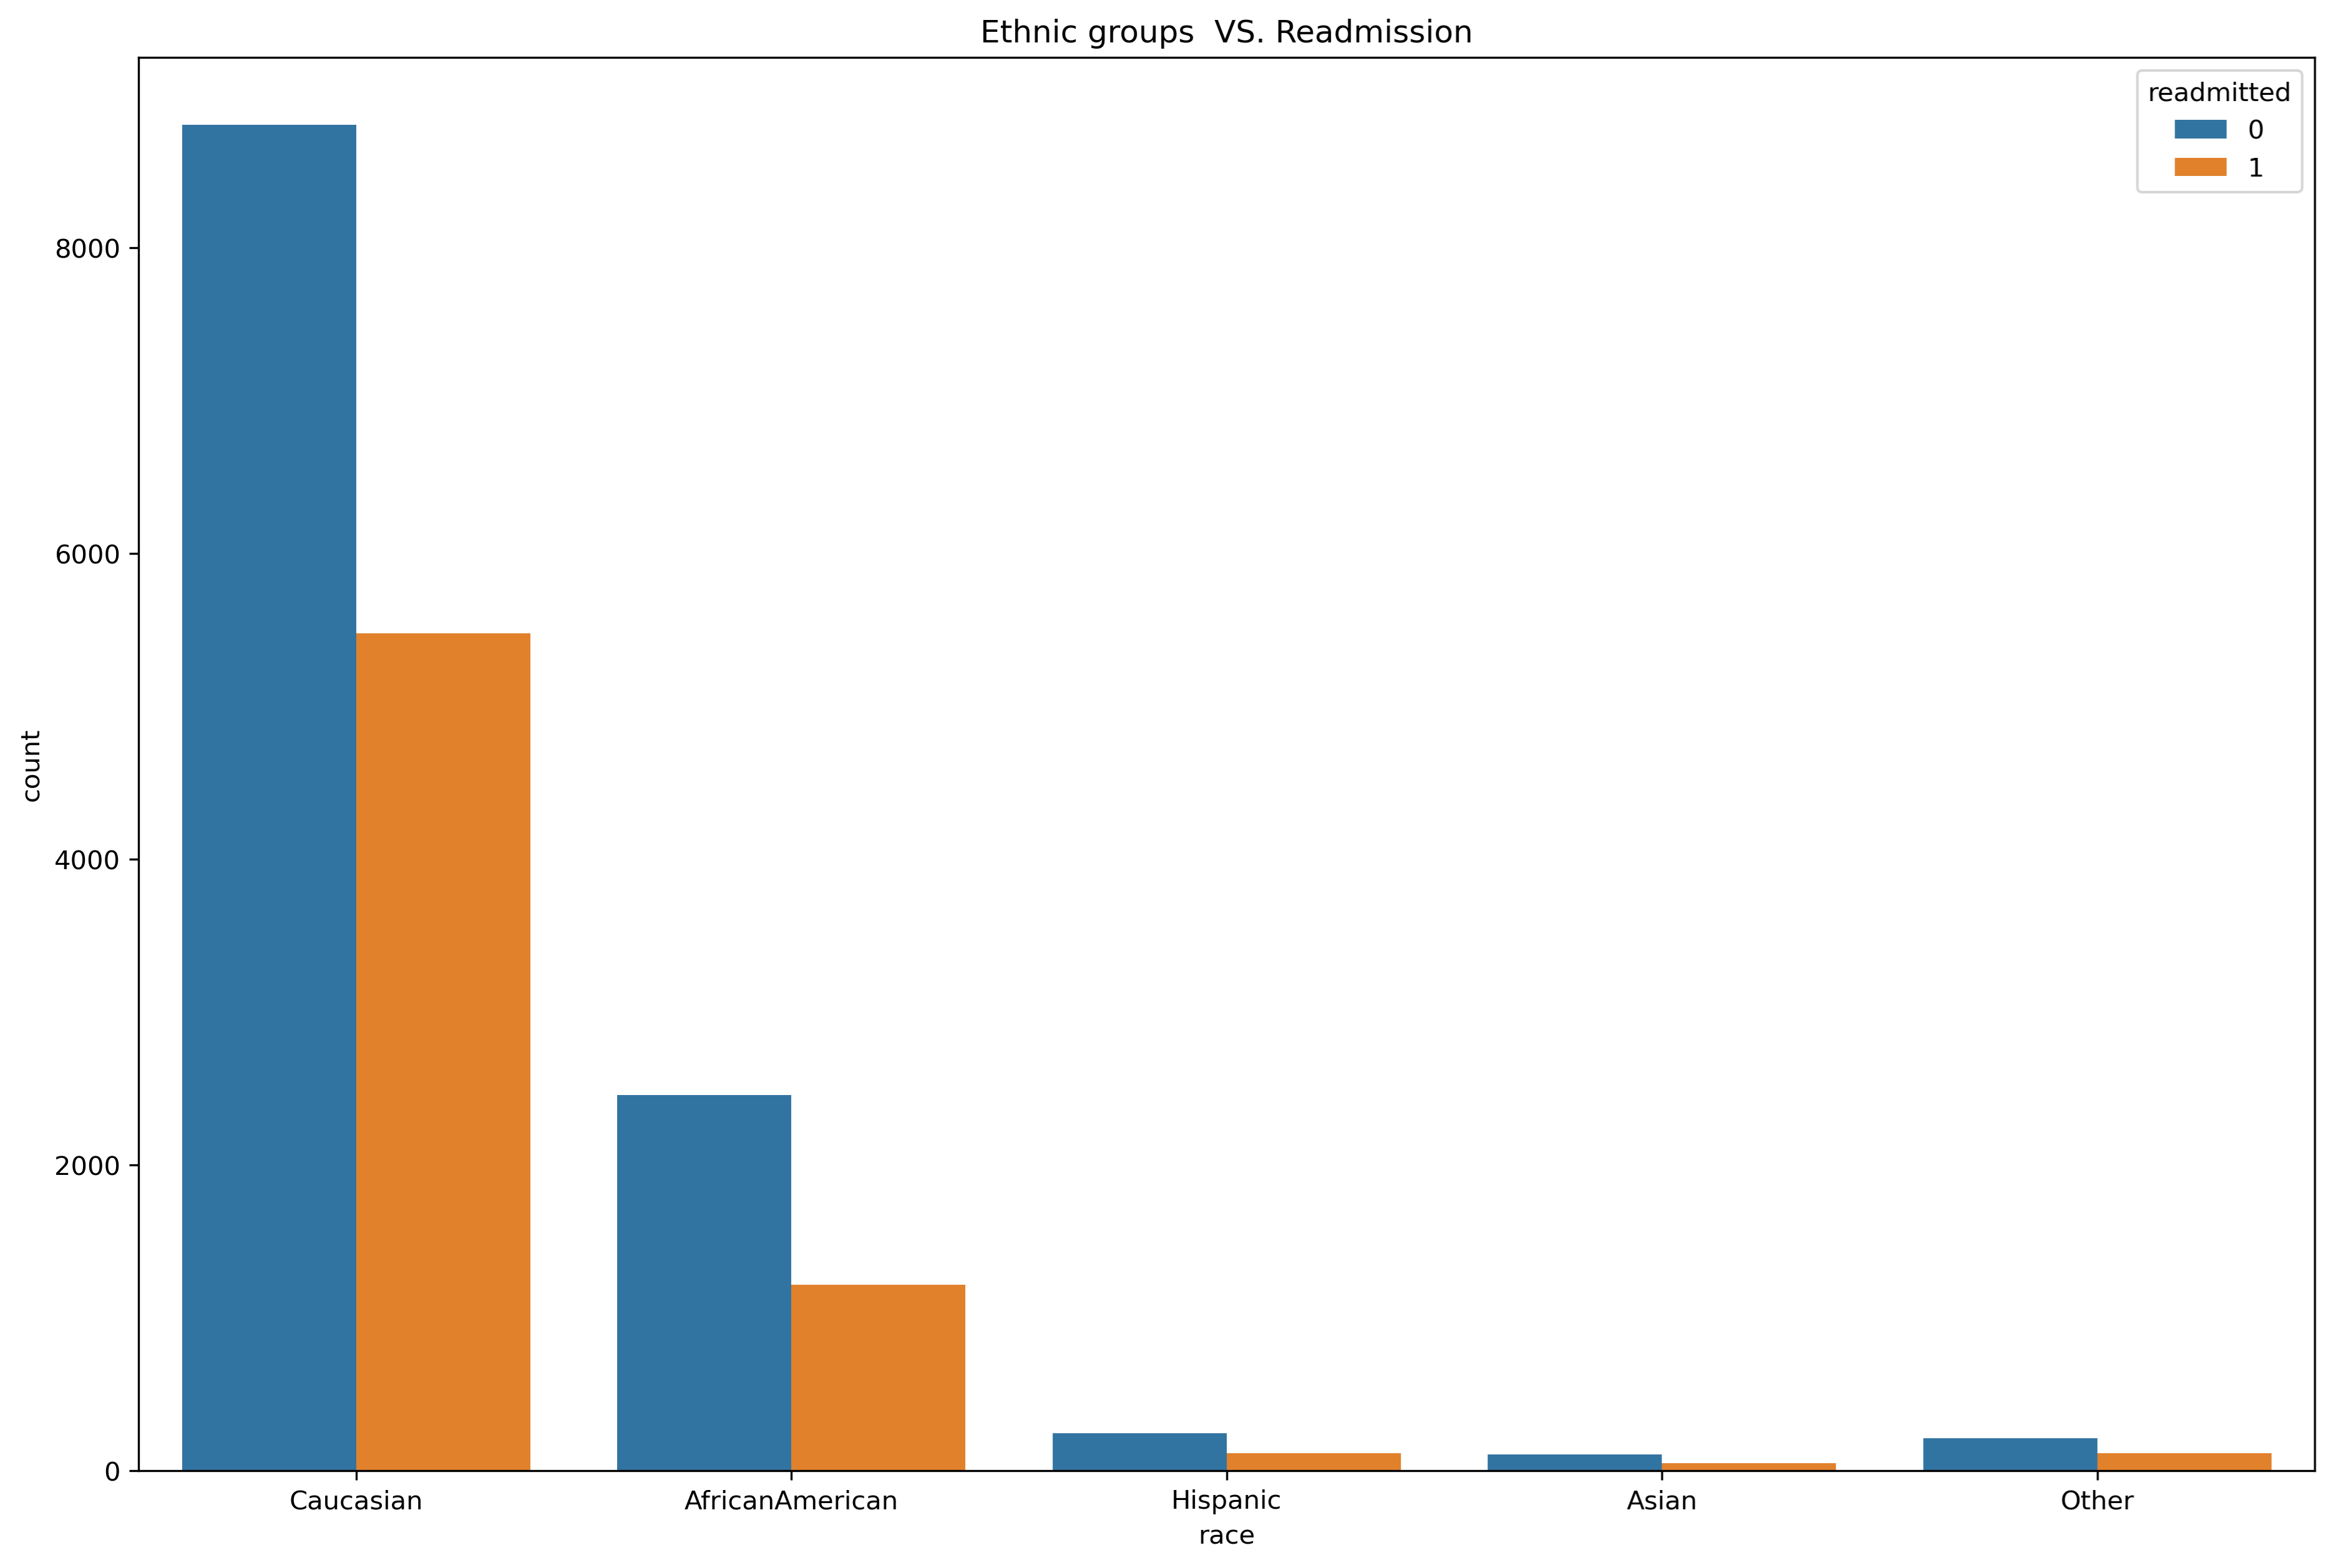
• Ethnic groups vs Readmission
The below shows us that Caucasian group is most likely to be readmitted rather than African American so the hypothesis African Americans are more likely to be re-admitted than other ethnic group is false.
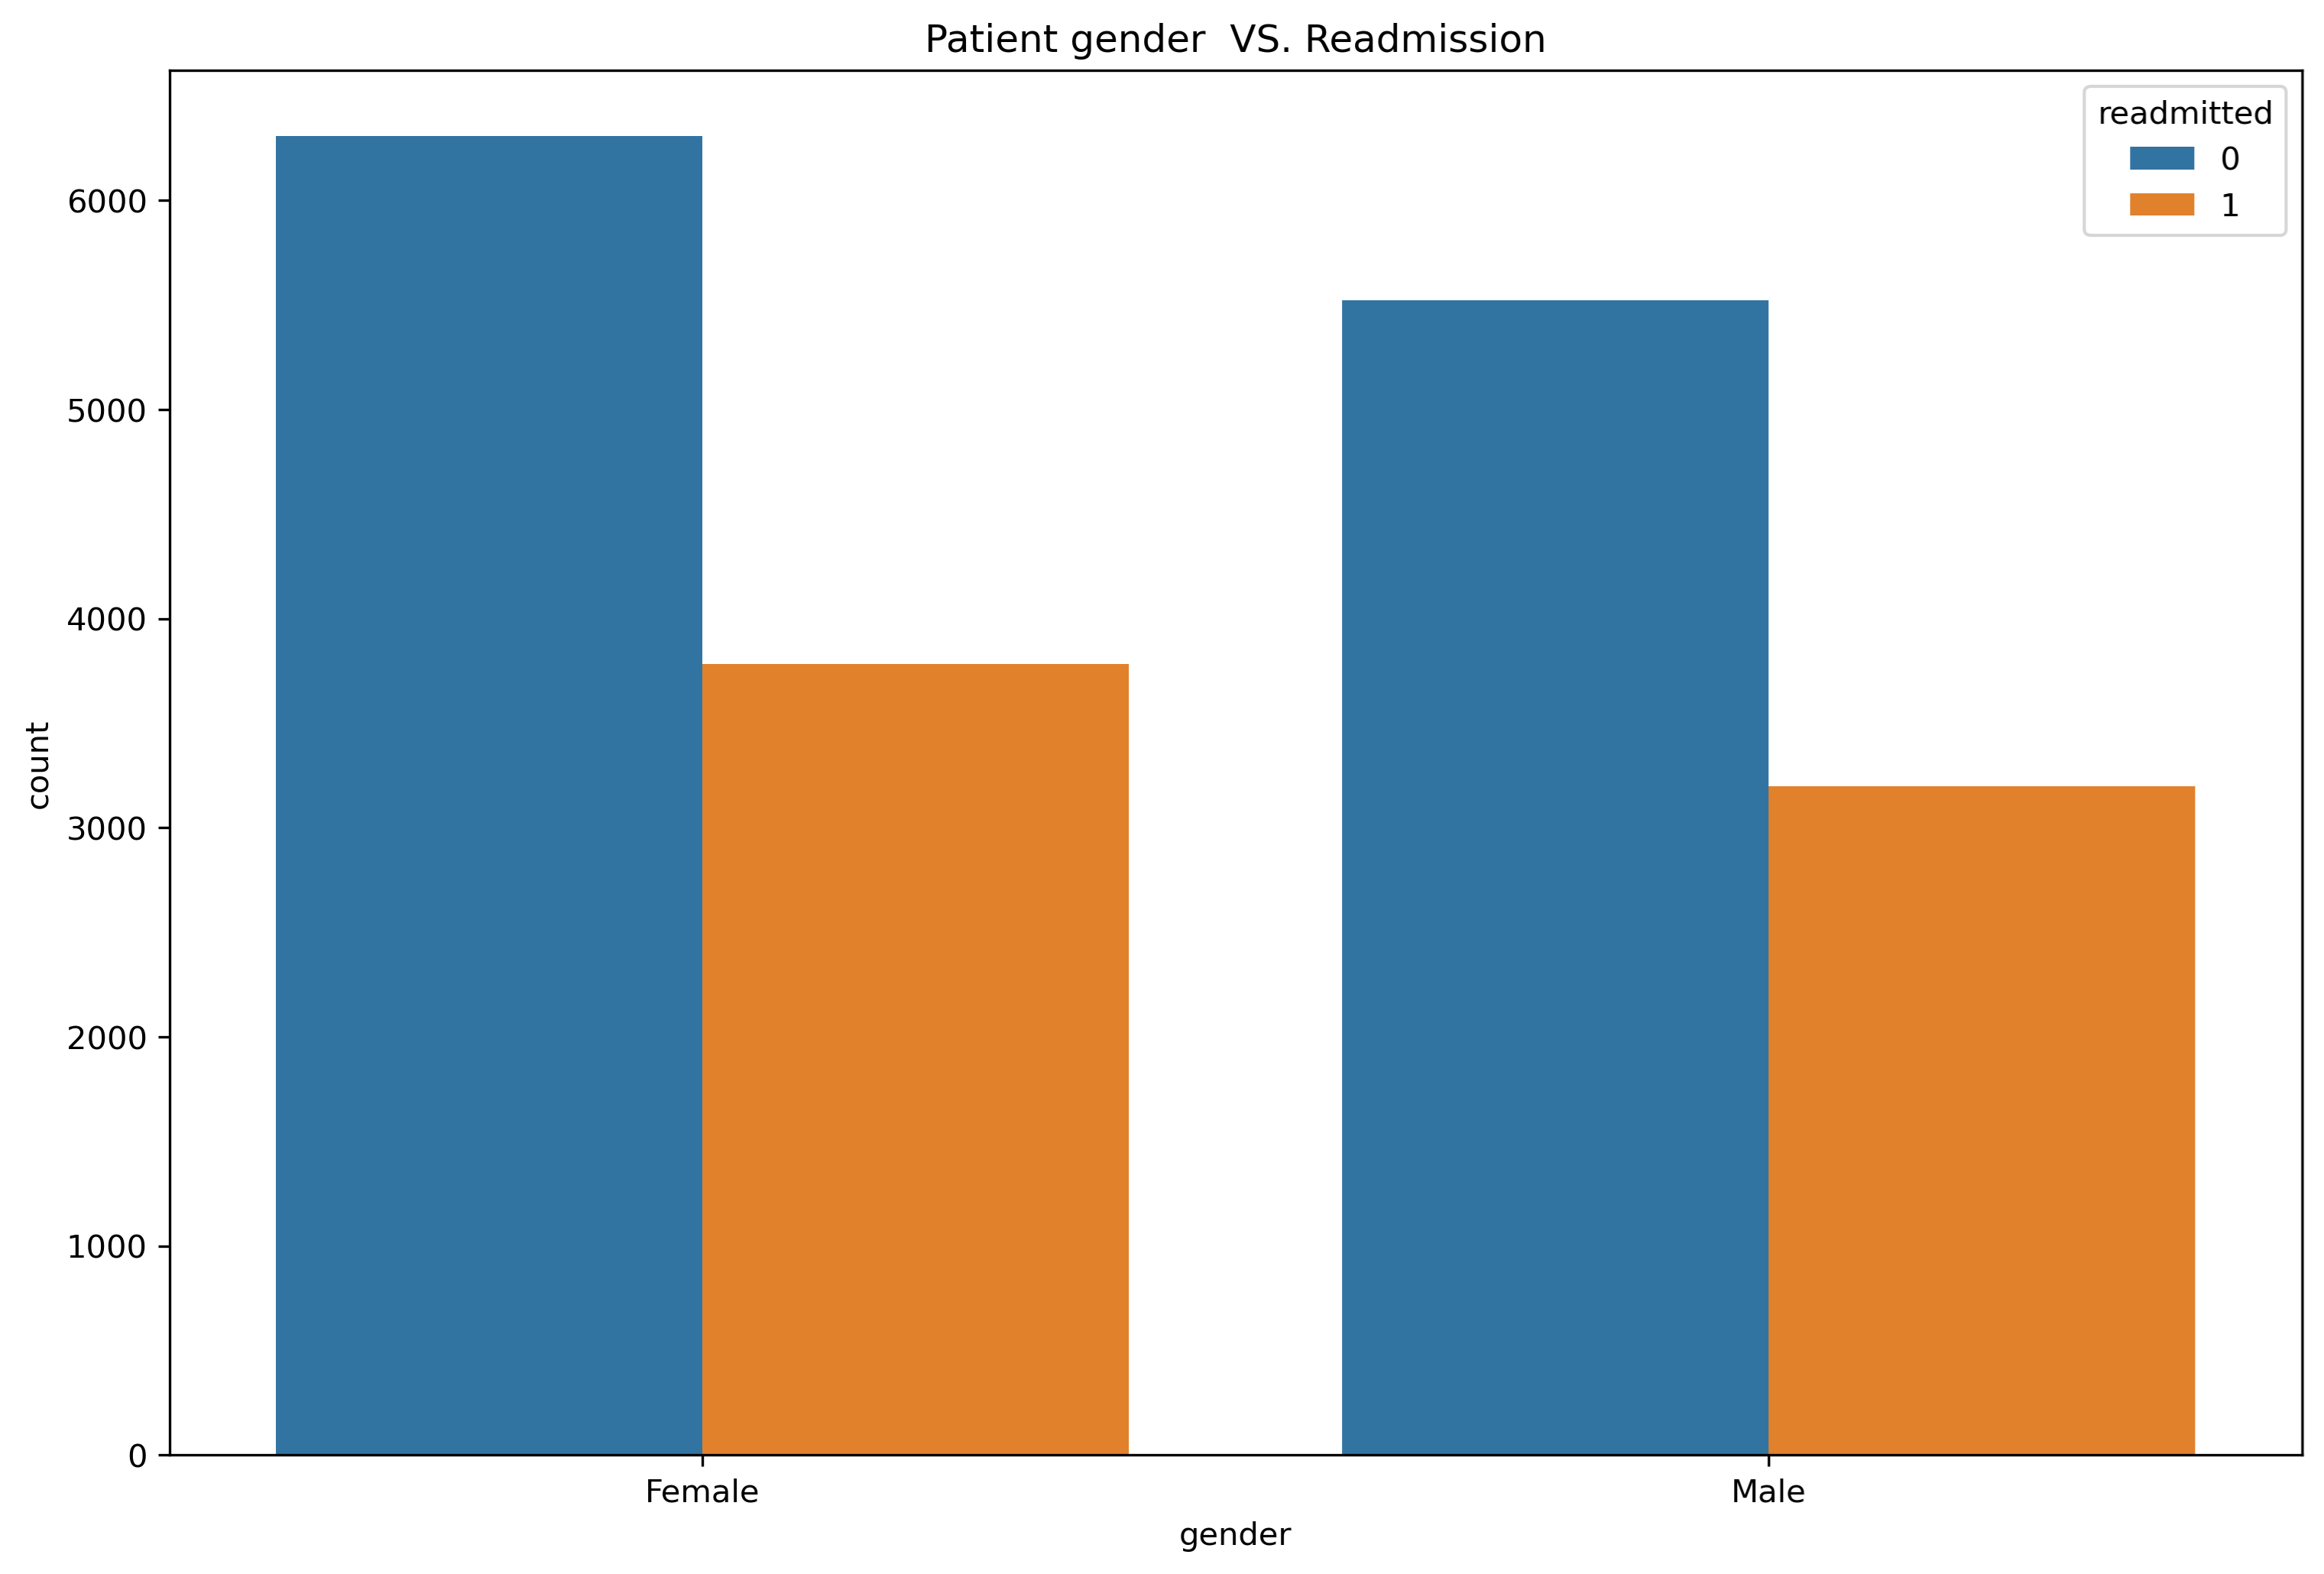
• Gender vs Readmission
As per plot below it can be said that the gender of the patient does not have more effect so the hypothesis Women patients are more likely to be re-admitted than men is false.
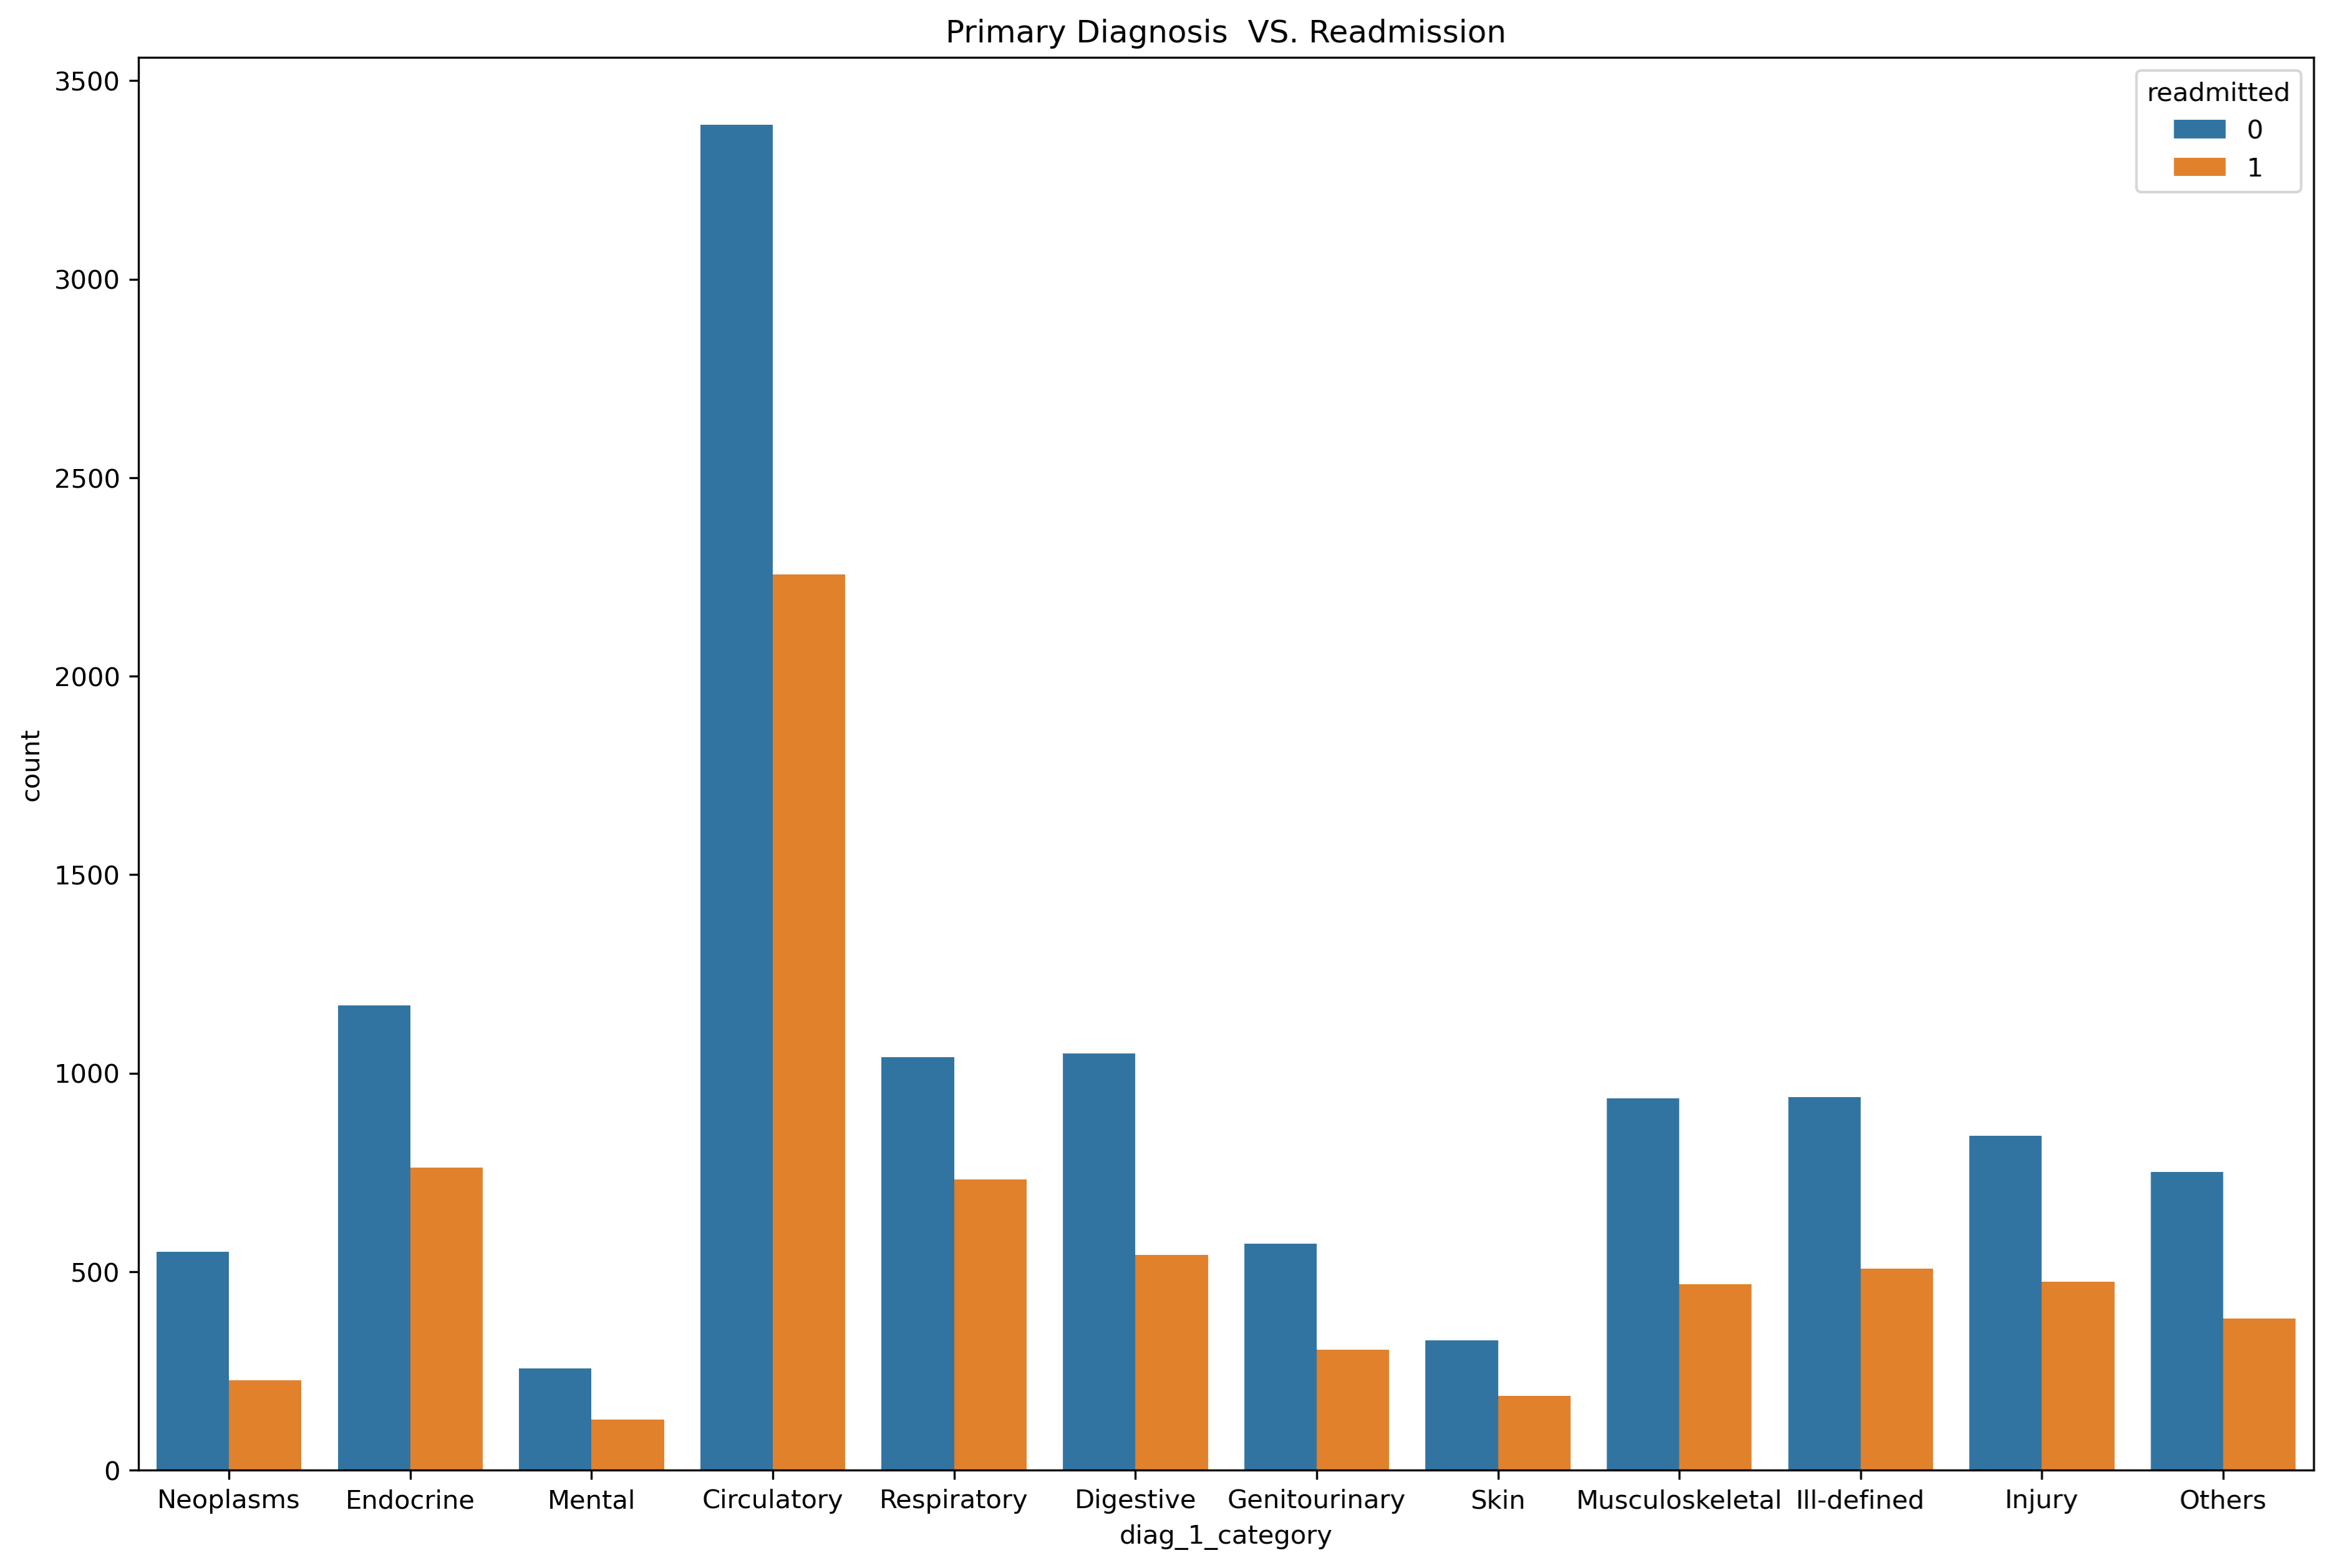
• Primary diagnosis vs Readmission
As shown in the below column diag_1 is compressed into few categories as per Wikipedia and as we can observe diagnosis types have higher impact on re admission rates so the hypothesis Diagnose types have a higher impact on re-admission rates is true.
• The readmitted column has already been converted to values 0 or 1
• The pre-processed data has been scaled using MaxAbsScaler to fit and increase model efficiency
• This are the features for the model 'num_medications', 'number_outpatient', 'number_emergency', 'time_in_hospital', 'number_inpatient', 'encounter_id', 'age', 'num_lab_procedures', 'number_diagnoses', 'num_procedures', 'readmitted'.
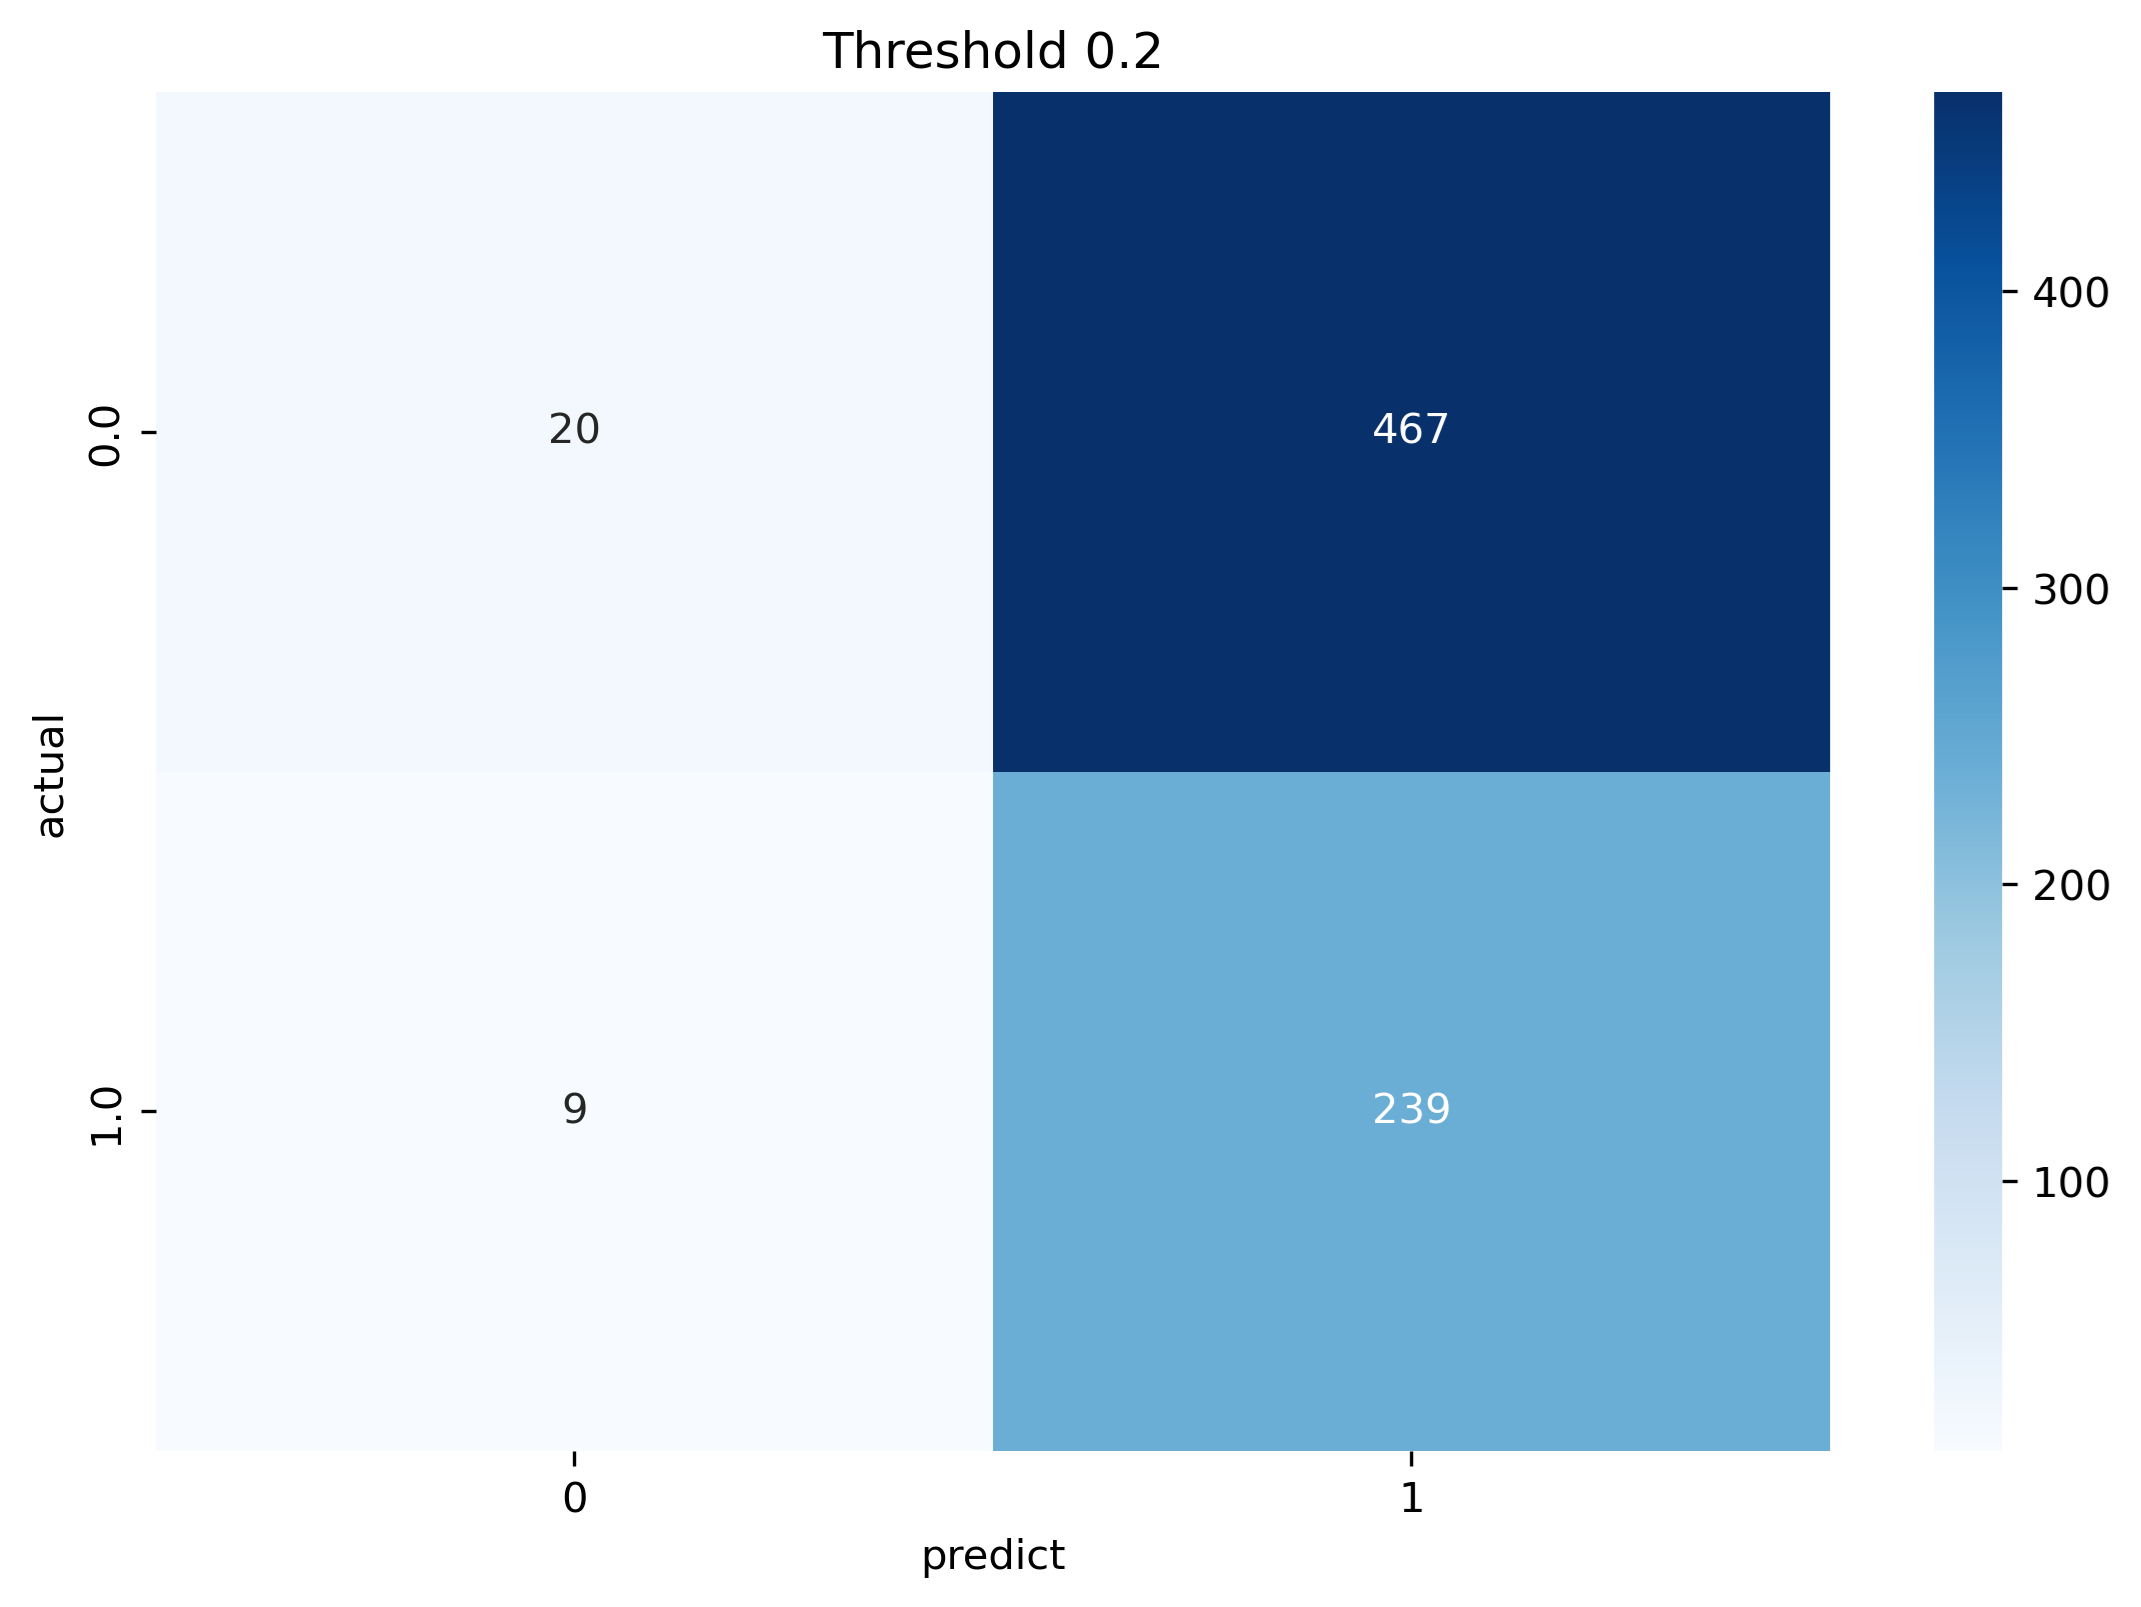
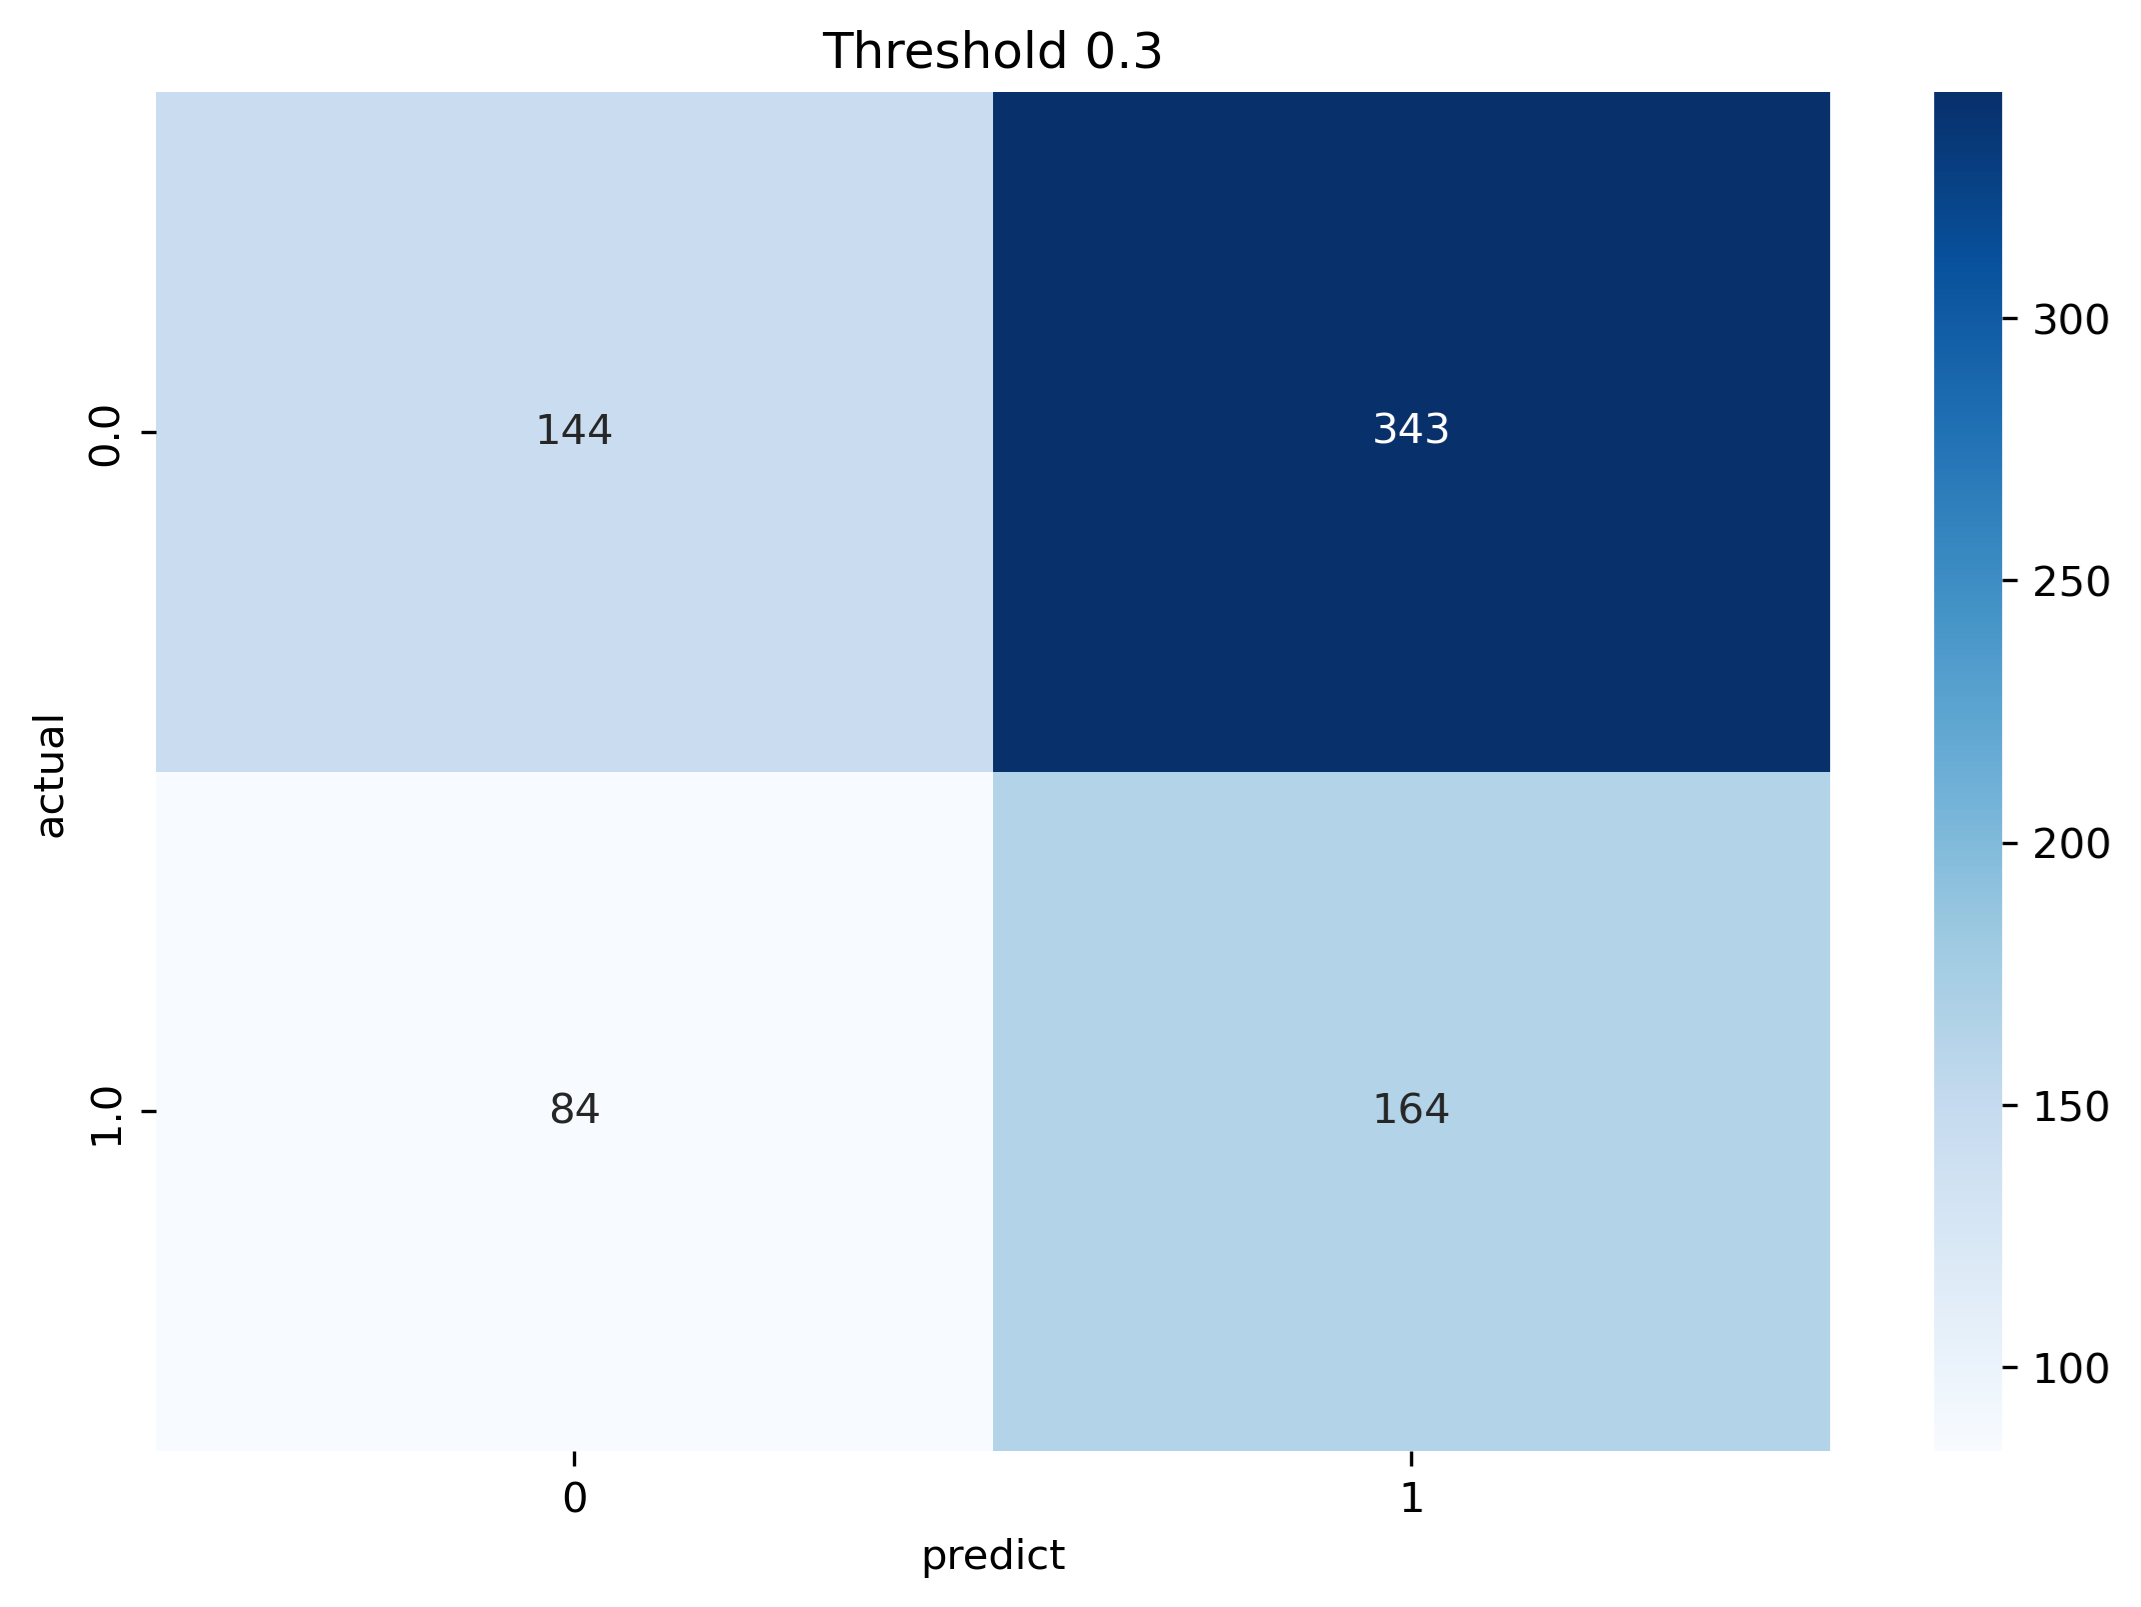
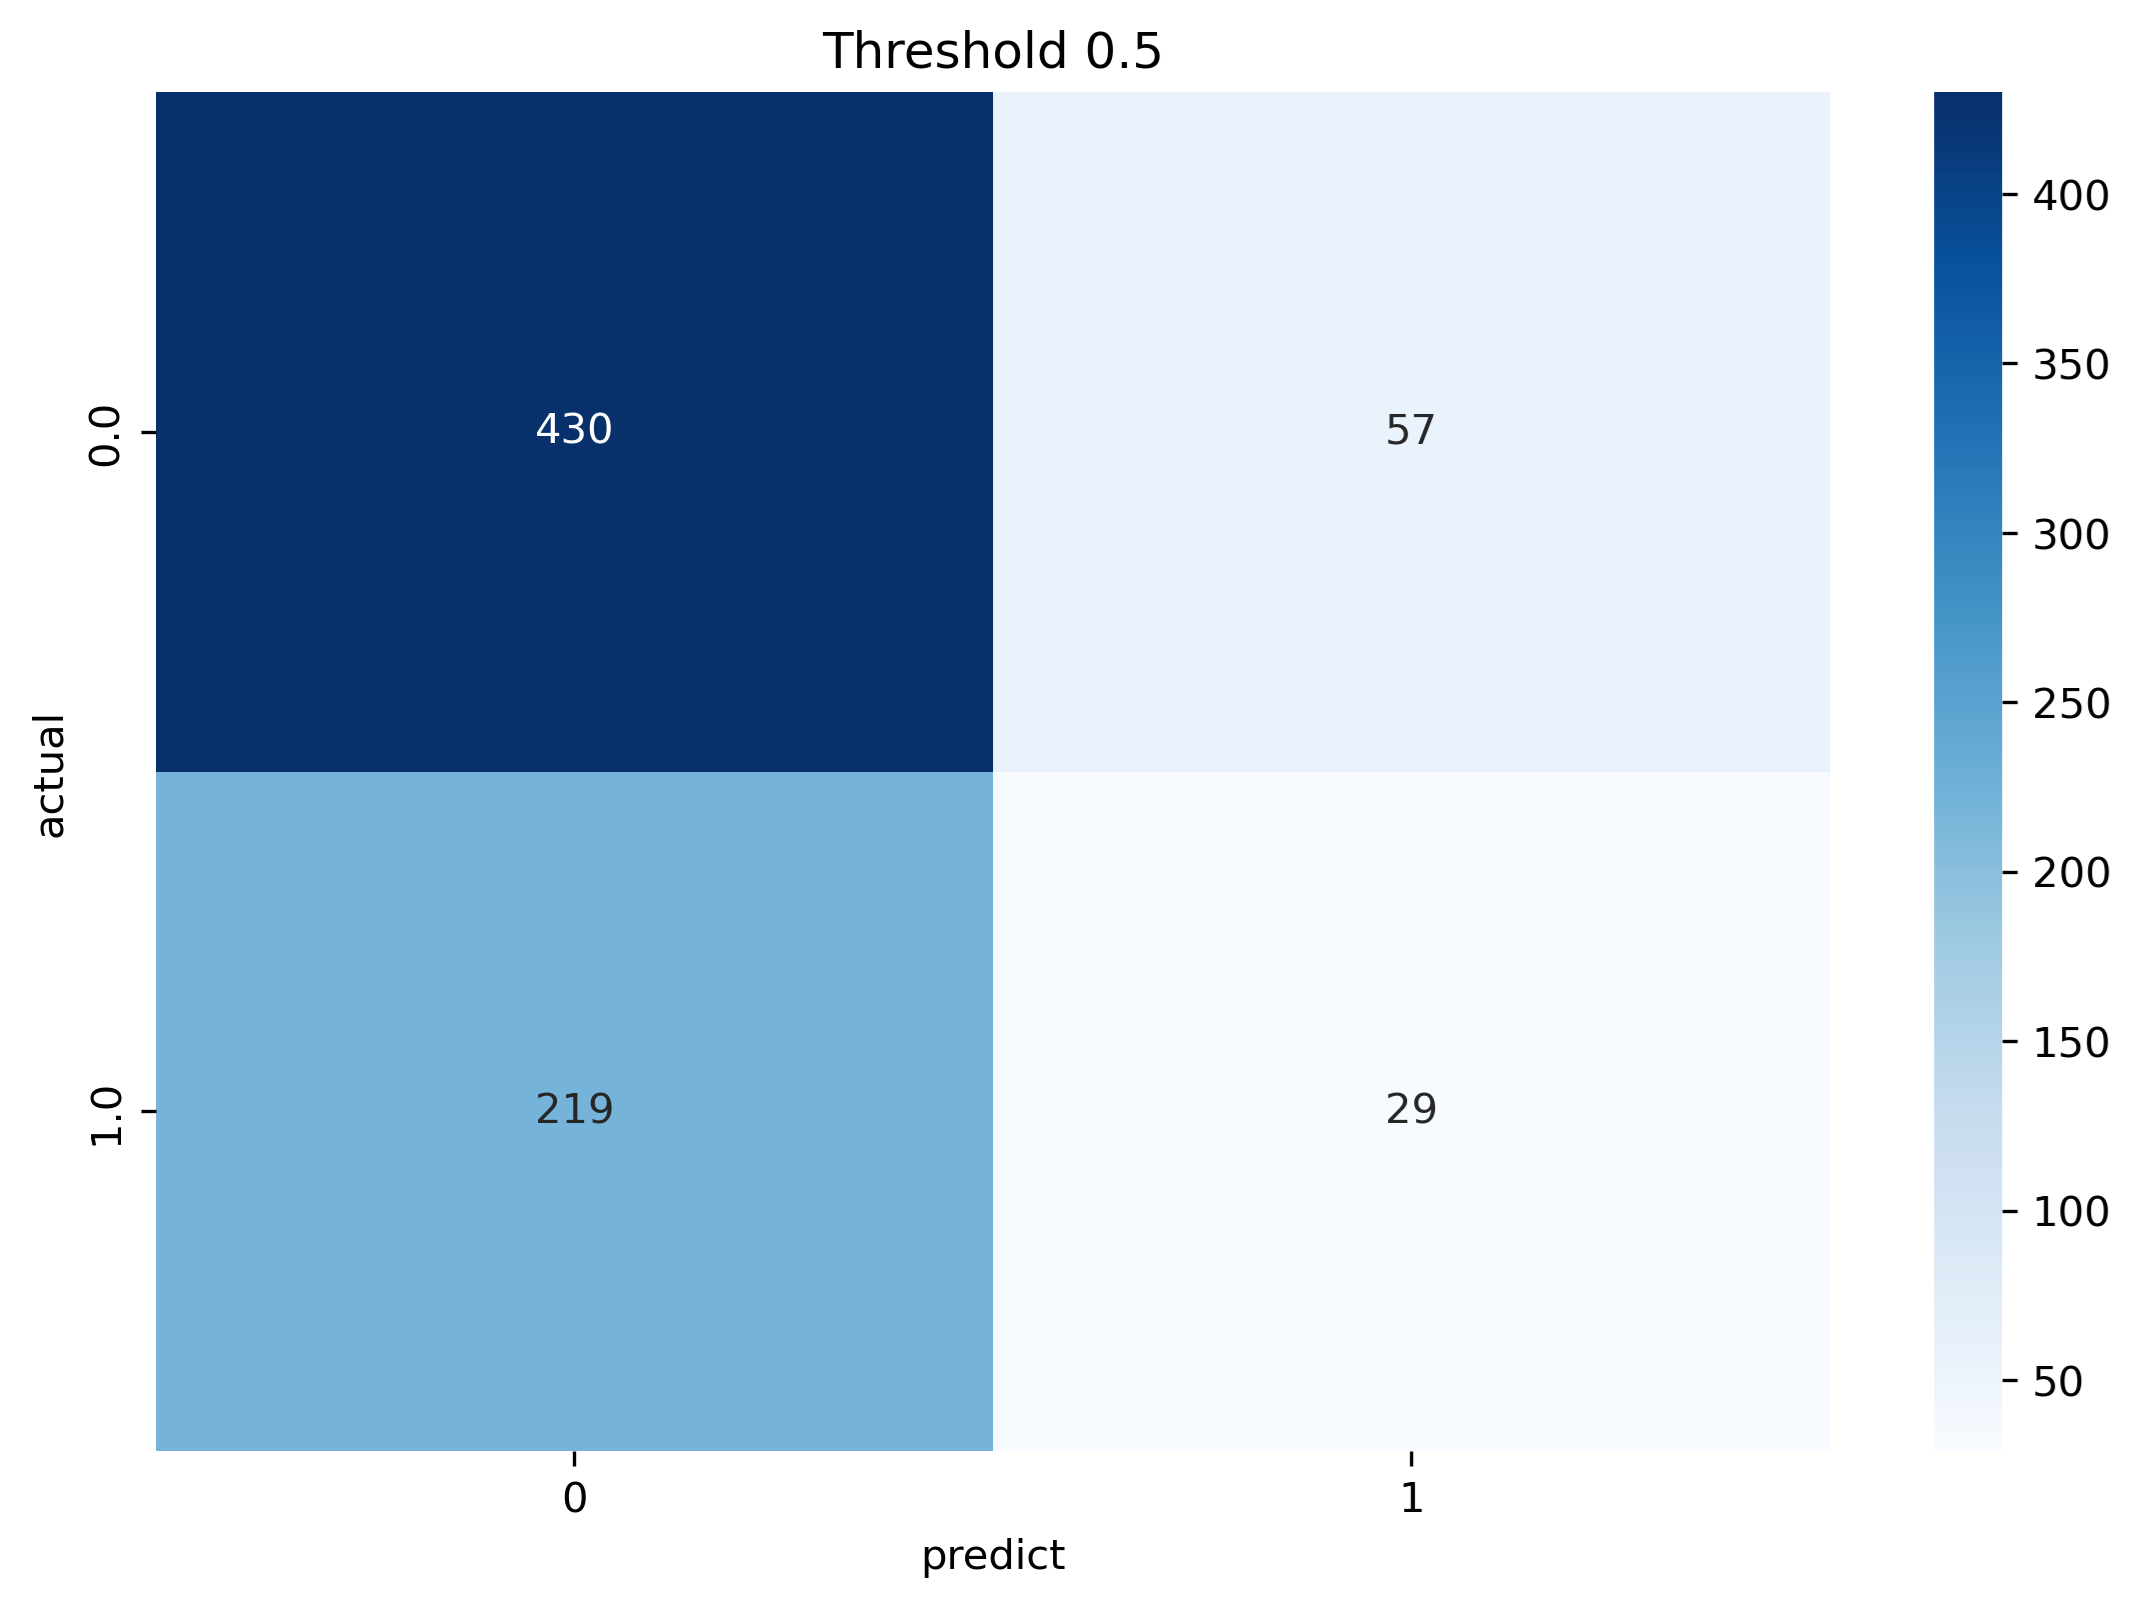
• Confusion matrix
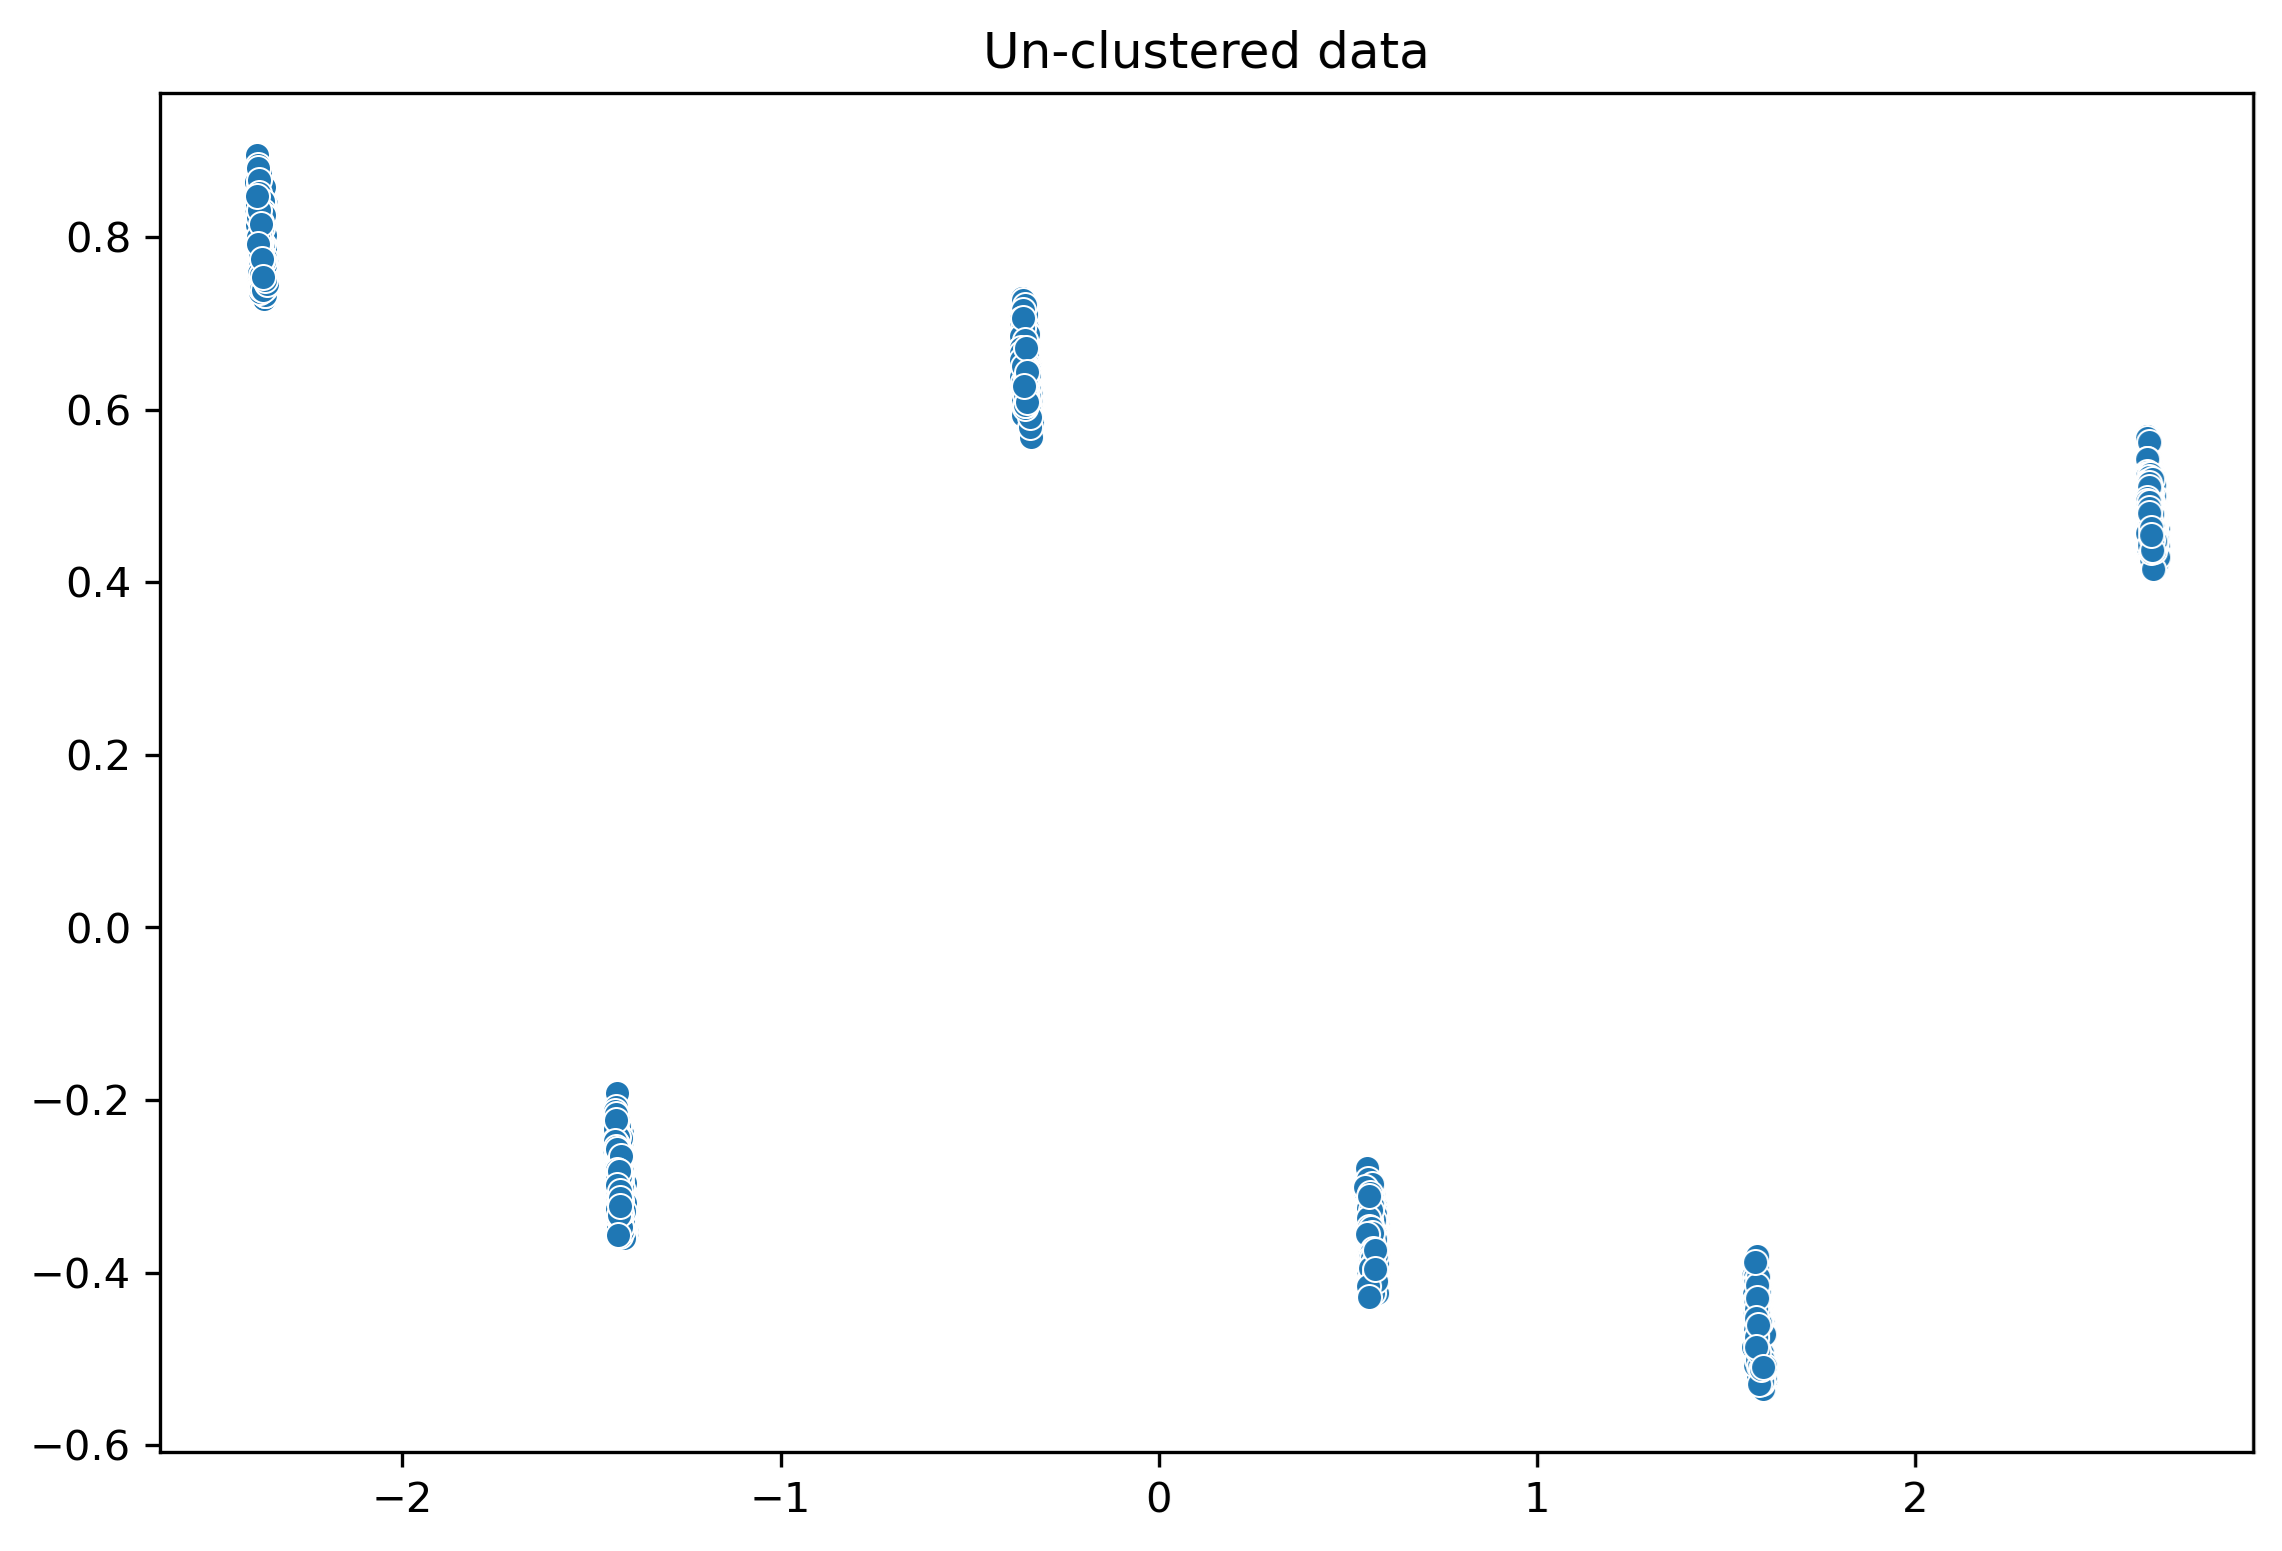
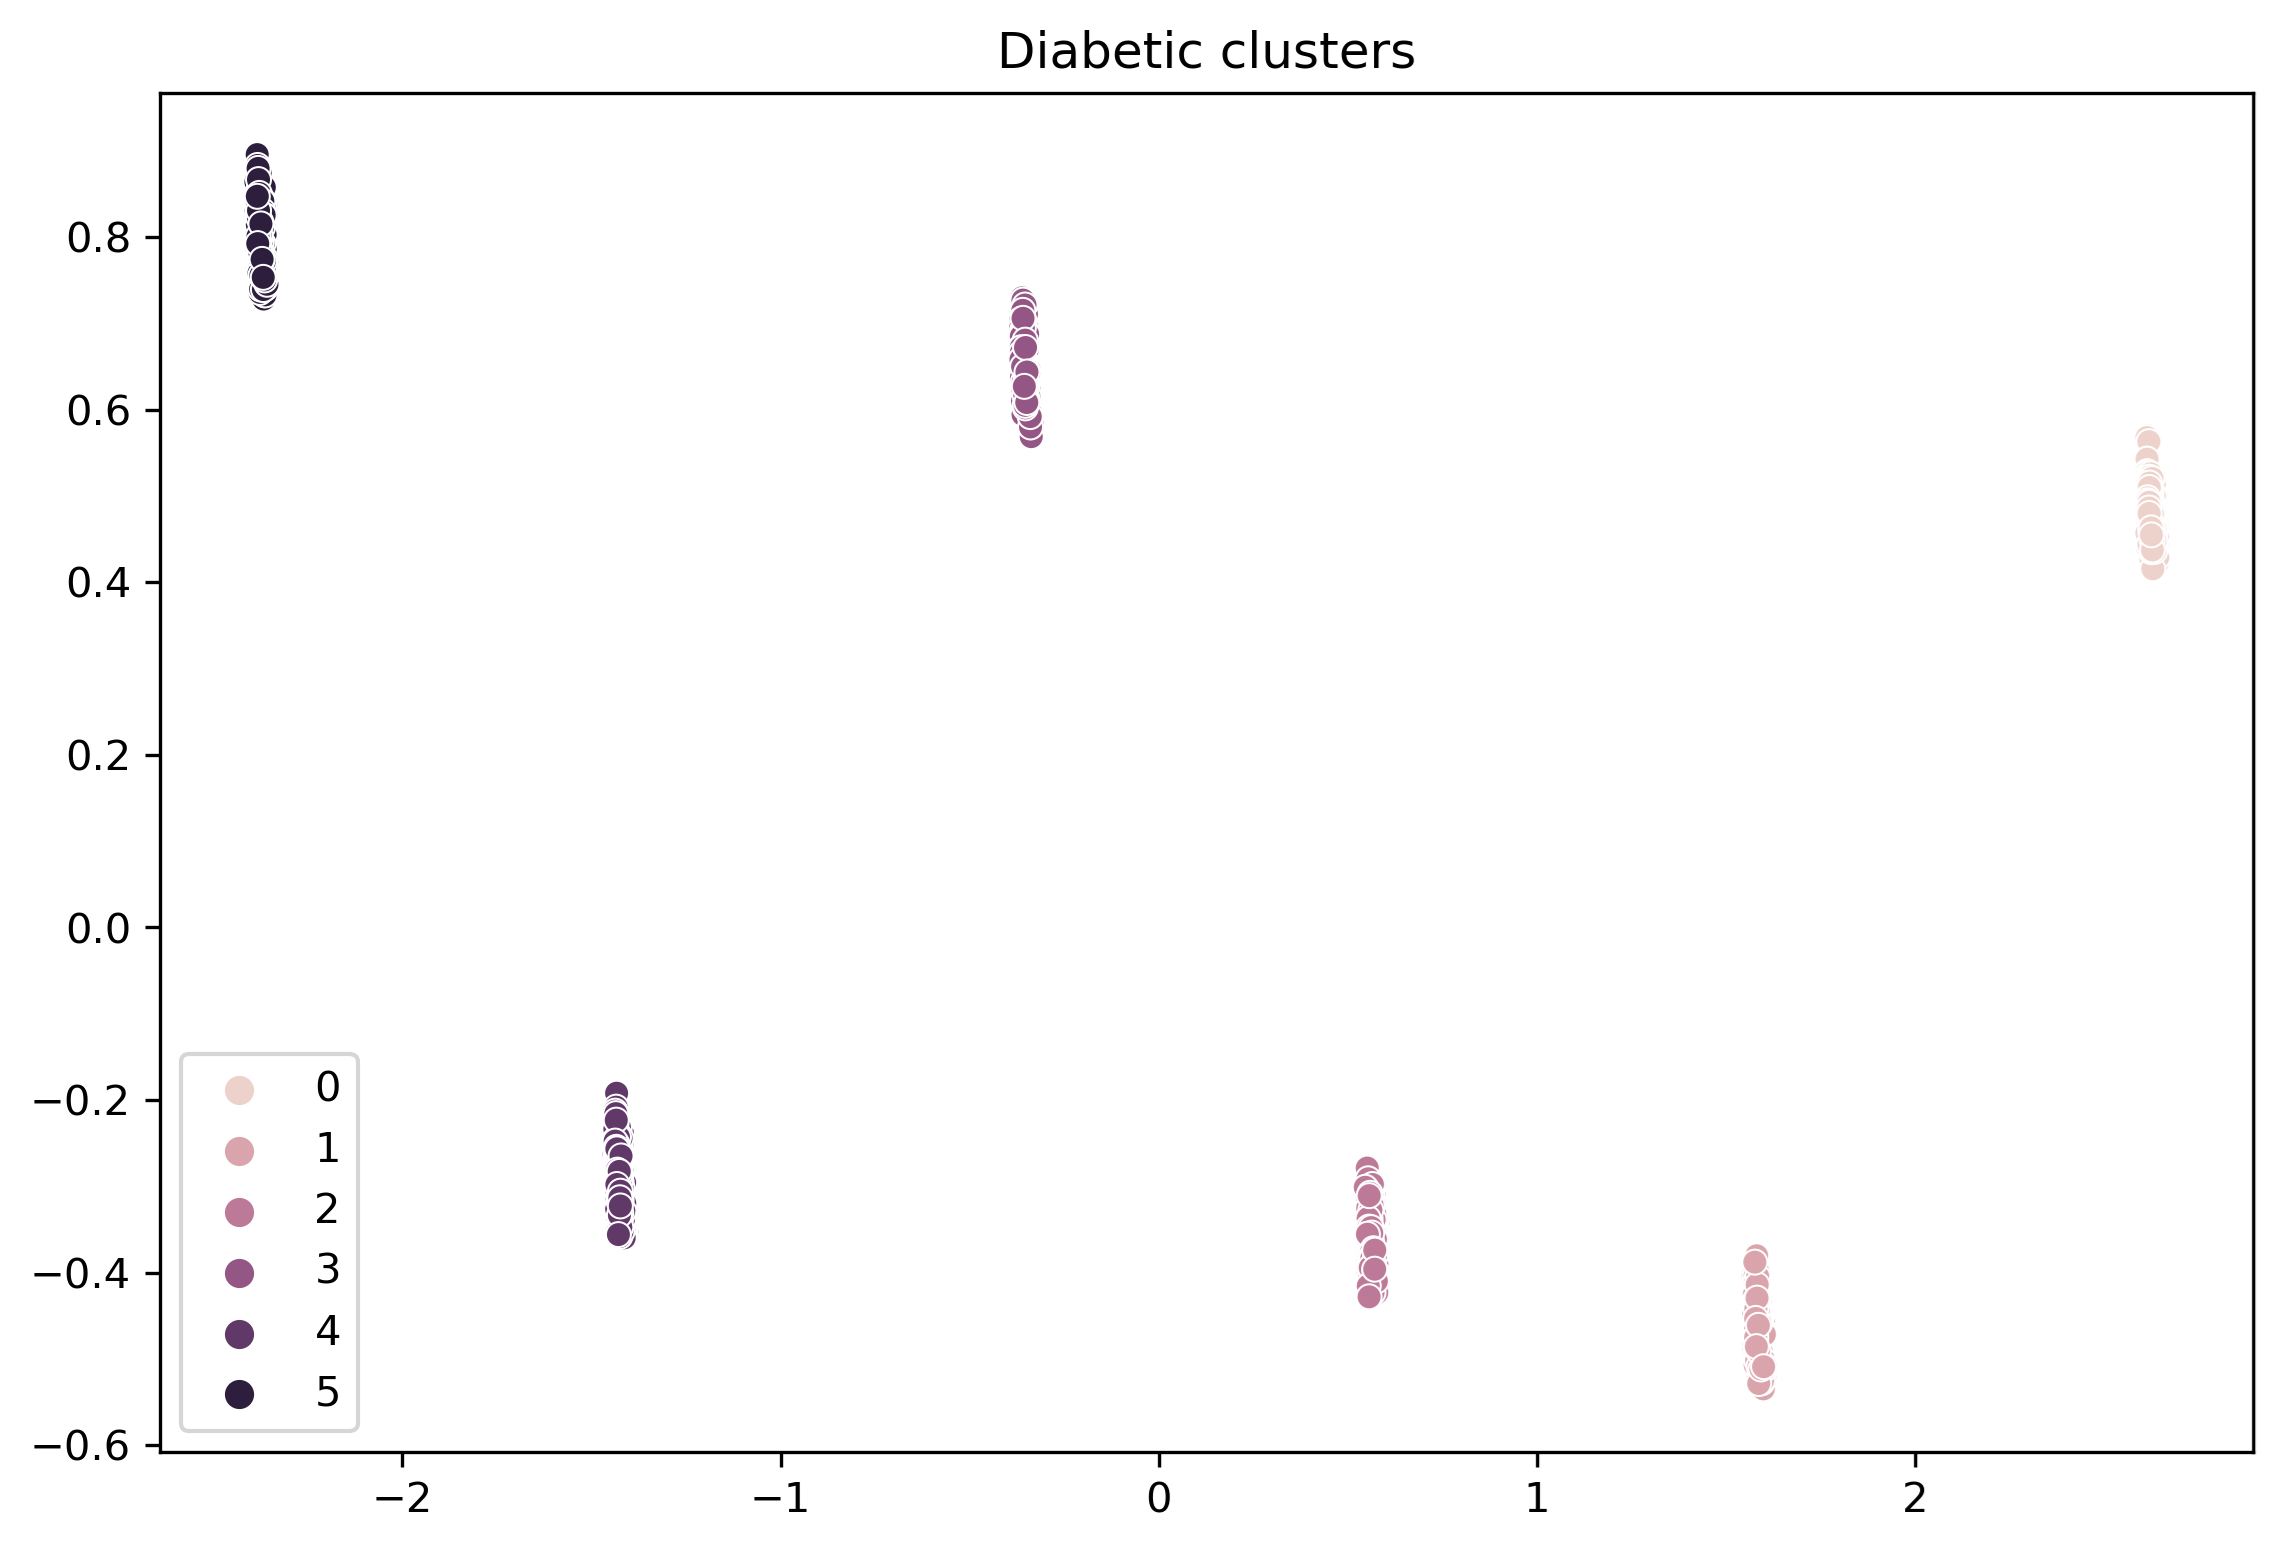
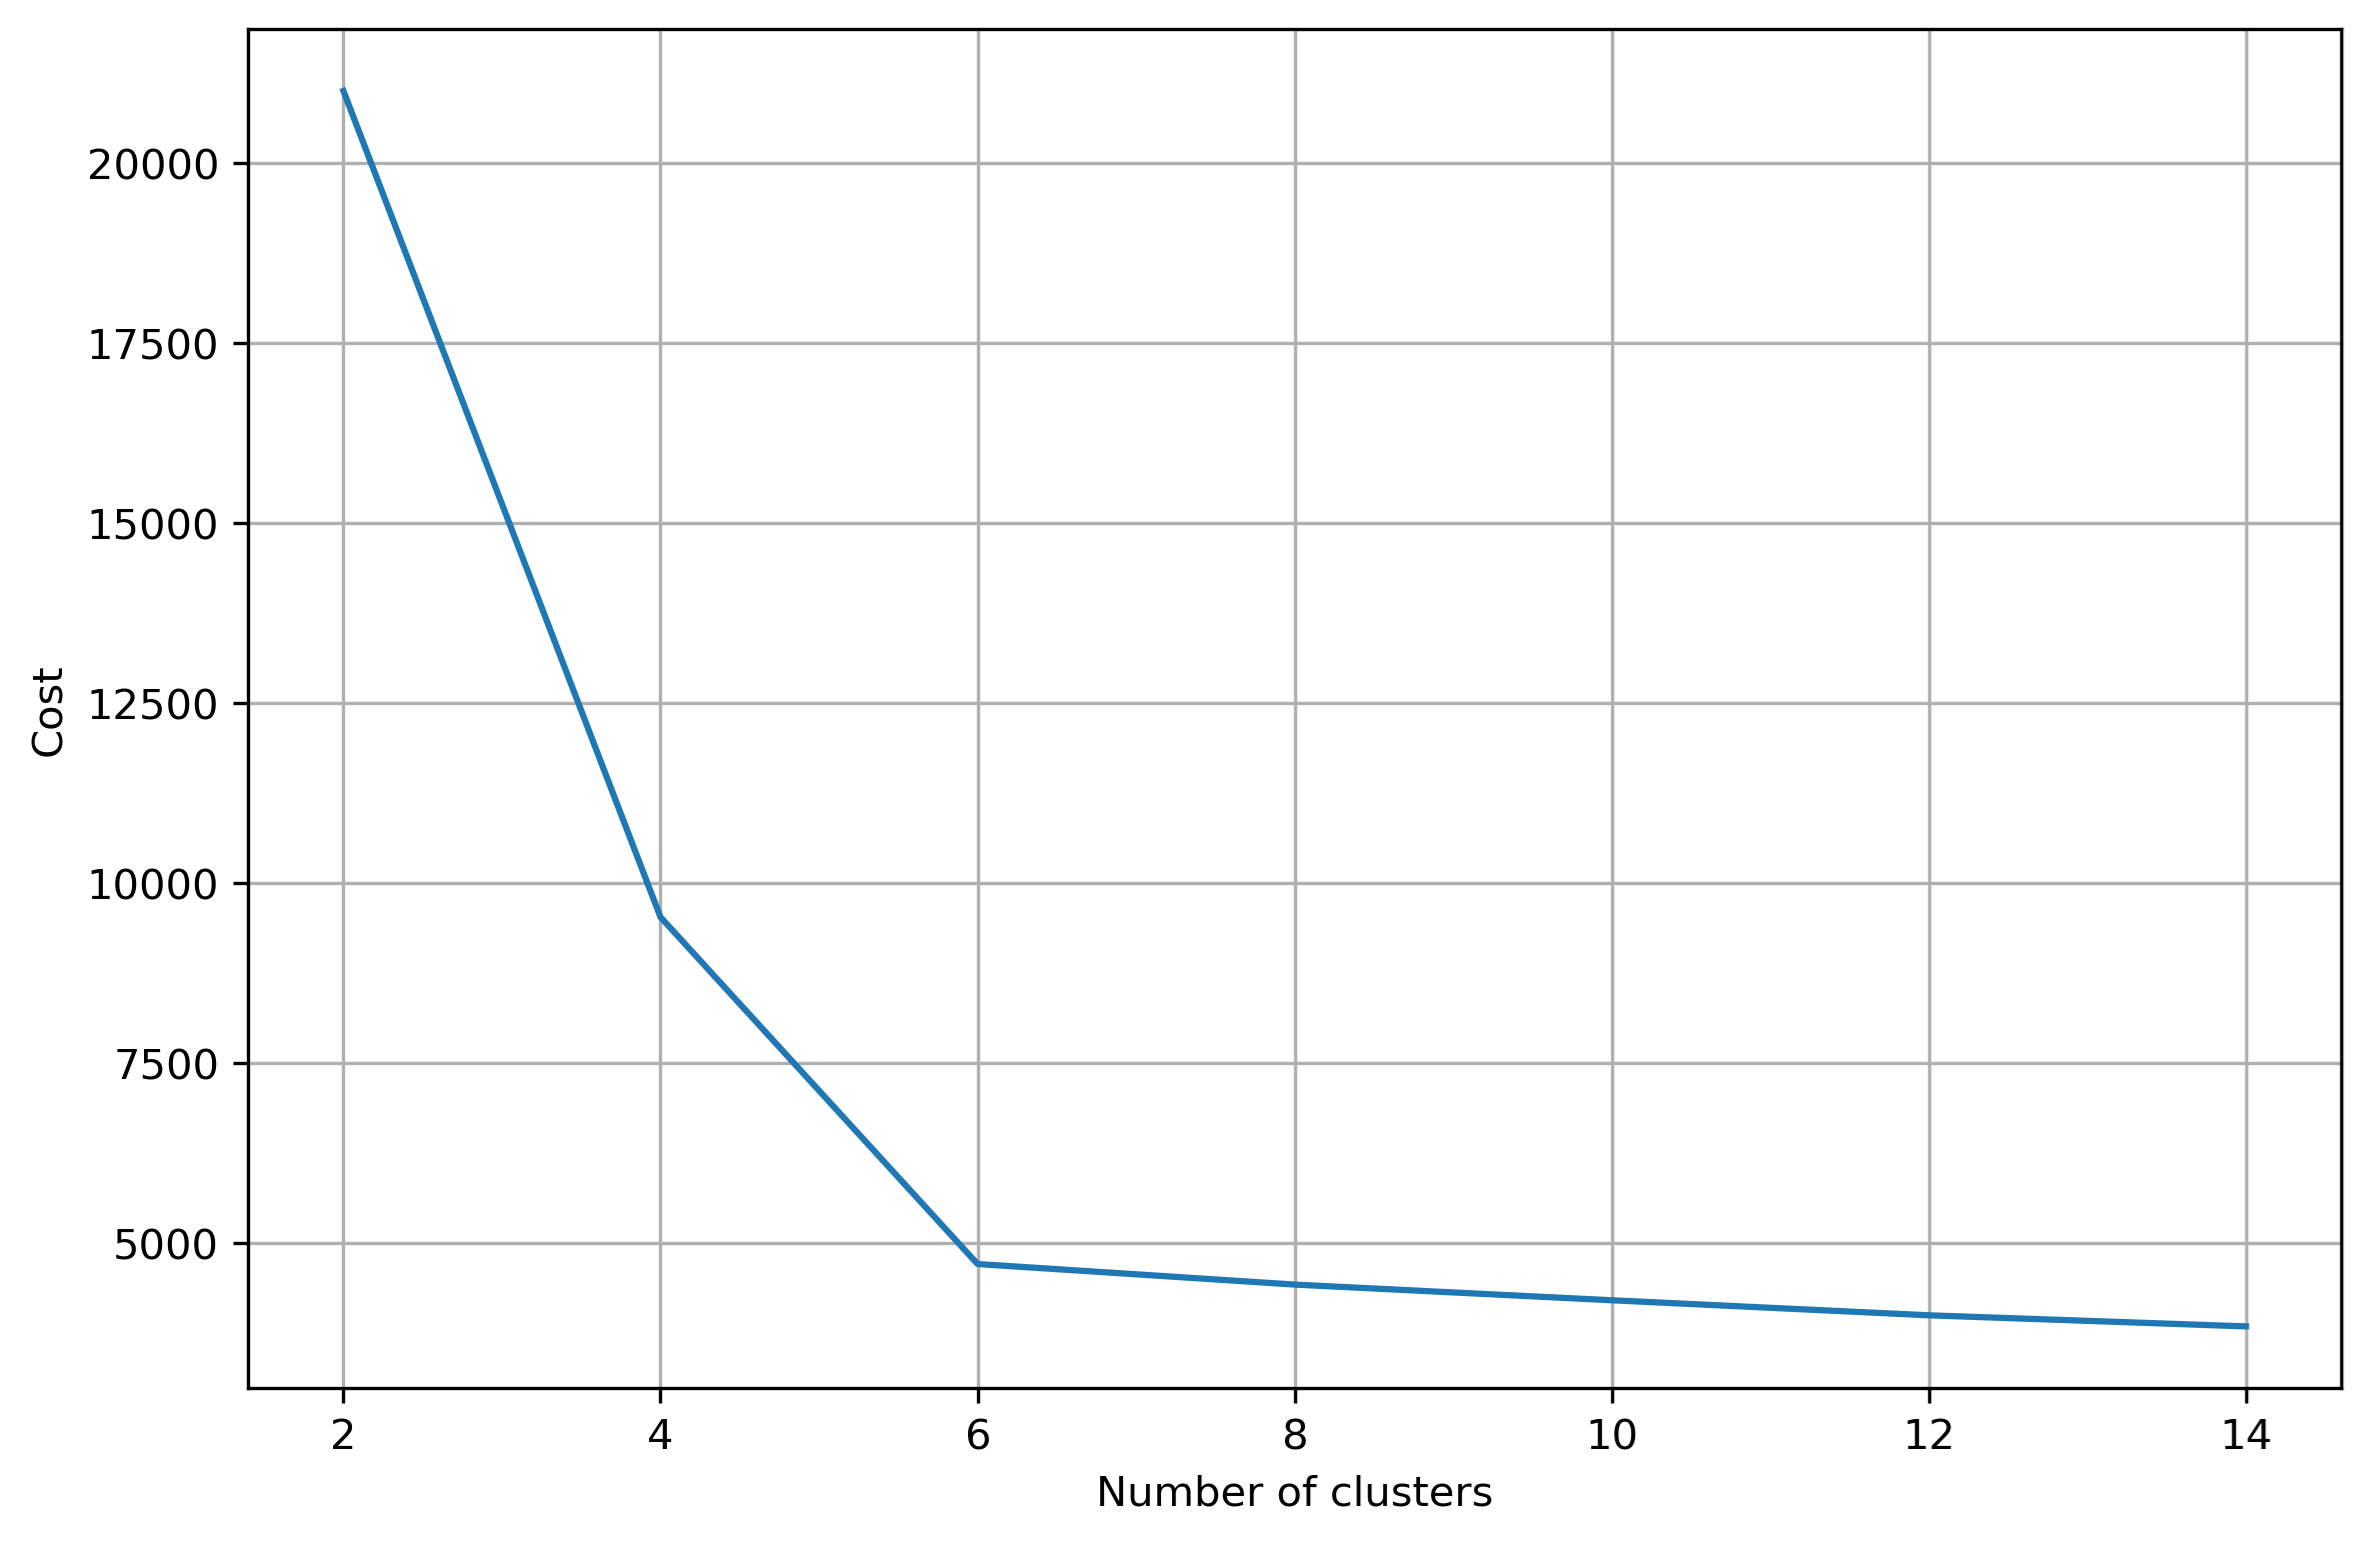
• Clustering