How many cases of coronavirus are around you?
Easy to find number in your State or County.
How about the number of cases in your area, between county level and state level?
Interactive dashboard at rpubs.com/rdam
- get counts of covid-19 cases by Longitude and Latitude and date (resolution at county level and 2 day)
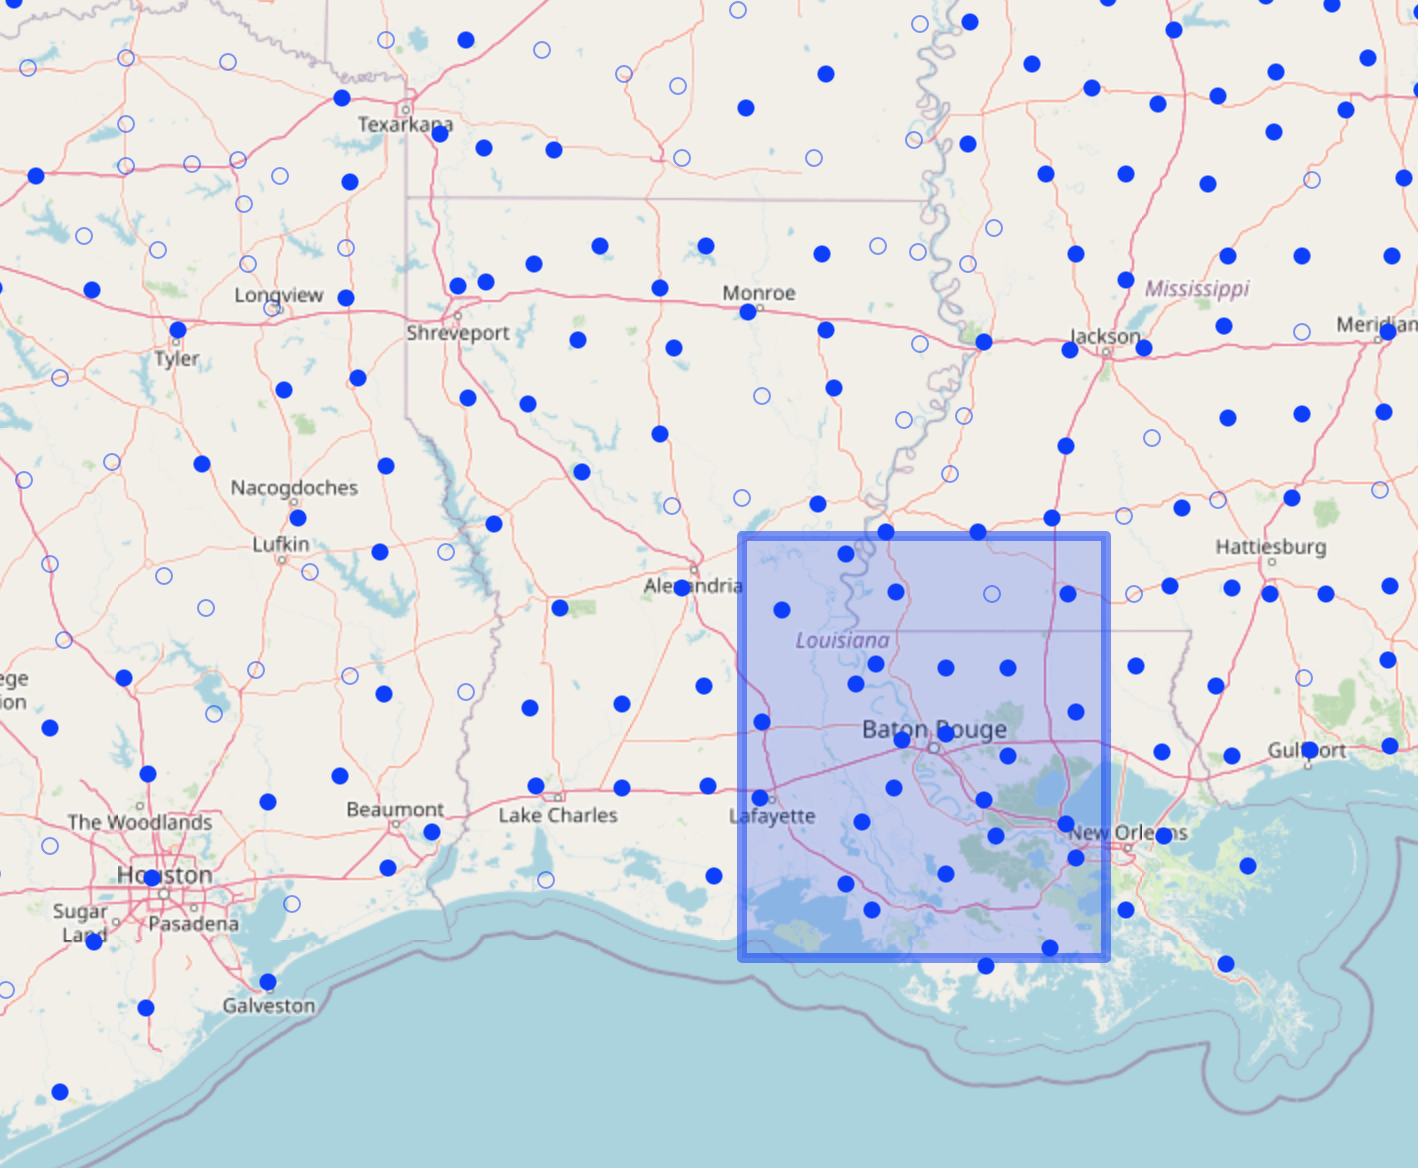
- create a square around your location of ~200 miles (or just sum all counties that are adjacent) -- sum all cases within that area
- then display a timeseries plot for that location
- also display radius vs. count, as a stay-at-home warning
i.e. counts defined by bounderies can be misleading for a place like upstate New York, getting a count of New York cases, when it is more realistic for the people of New Jersey to be concerned.
So far we have a buffer set up with a 3 degrees in longitute and latitude, then the distance in miles is estimated assuming Earth is a sphere. (approx. 300x300 mile square)
The next step will be to set buffer in terms of miles and create a polygon instead of a square. Also estimate distance from an elipsoid instead of a sphere. equatorial radius = 6378 km, polar radius = 6357 km
- what is the diffence? is it even worth calculating?
This is an Rsudio project. Data obtained from Corona Data Scraper https://coronadatascraper.com/#home